
Examining China's M&A Boom
An article in last week’s issue of The Economist showed that China’s outbound M&A activity[1] has risen sharply of late, up approximately fivefold since the summer of 2015 and eightfold above its average rate between 2010-2015.[2]
The article mentions that this increase could represent a troubling trend of capital fleeing China in response to China’s experiencing slowing economic growth and a gradually depreciating currency in recent years.
It then largely dismisses this theory, however, saying, “rather than sparking a stampede [of money] to the exits, it is more accurate to say that these changes [in China’s economic performance] have alerted Chinese firms to the fact that they are still woefully under-invested abroad. China’s share of cross-border M&A has averaged roughly 6% over the past five years, despite the fact that it accounts for nearly 15% of global GDP[3]".
Implicit in these words is the expectation that a country’s share of global M&A should not be too different from its share of global GDP. Yet this overlooks several other factors that may determine a country’s propensity for engaging in M&A. These may include a country’s role in international trade, or a country’s proximity, cultural and linguistic affinity[4], or political relationship with other large economies and foreign financial hubs.
China ticks each of these boxes in a notable way. It is both physically and linguistically isolated from most the global economy beyond its own borders: East Asia outside of mainland[5] China accounts for only 12% or so of world GDP[6], while the combined GDP of the world’s majority-Chinese economies outside of mainland China is about nine times smaller than that of mainland China itself[7].
China’s political relations are somewhat fraught. 45% of East Asia’s GDP outside of mainland China occurs in China’s regional rival Japan[8], 4% occurs in Beijing’s rival Taiwan, and 25% of global GDP is in its potential rival superpower the US[9].
China’s propensity toward international trade is, similarly, not pronounced[10]. China accounts for an estimated 11% of international trade, compared to 15% of global GDP.
Finally, apart from Taiwan, the only notable majority-Chinese economies outside of mainland China are business-financial hubs: Singapore and Hong Kong. Such hubs historically tend towards very high M&A activity, and towards being net originators rather than targets of M&A deals[11]. China’s global share of outbound M&A might therefore be higher were these not financial hubs. If, for example, Hong Kong was considered to be part of mainland China[12], China’s outbound M&A would in most years have been meaningfully higher than it has been[13].
The value of China’s outbound M&A as a share of global cross-border M&A should perhaps be lower than China’s share of global GDP, then. Yet so far in 2016 it is on pace to be much higher than China’s share of global GDP. The M&A boom could be capital flight after all.
————
NOTES:
1 — Specificially, the “value of announced outbound mergers and aquisitions including net debt of targets”, according to the article. Notably, however, ”announcing deals is not the same as closing them. Between losing out to other bidders and rejection by regulators, China’s investment tally could fall [below what it has announced].” “Nevertheless”, it goes on, “the trend is unmistakable. In recent years China has consistently accounted for less than a tenth of announced cross-border M&A deals; this year its share is nearly a third.”
2— According to this article in the Financial Times, “Chinese buyers account for an estimated 15% of the value of cross-border M&A that has occured thus far in 2016”. The Chinese offer to buy the Swiss company Syngenta, if accepted, is roughly big enough to eclipse all outbound chinese M&A in any year before 2014.
3- The article goes on to say “…Strategic considerations—acquiring technology and brands that China lacks—are more important [than moving capital out of China] for buyers [of foreign companies], both to bolster their position at home and to speed expansion abroad.”
4 - The following quote is from Clifford Chance and the Economist Intelligence Unit, from 2012: "Despite the growing need for companies to invest in new markets in order to realise their growth ambitions, more than one-half say that they are discouraged from acquiring overseas because of concerns about bridging cultural differences. This rises to 63% for respondents in the US. Many companies admit that they find the softer side of deal-making challenging, with just 44% of companies saying that they are effective at handling cultural integration as part of the transaction process.”
5 — “Mainland China” in this case does not include Hong Kong, Macao, or Taiwan, but does include other Chinese islands like Hainan and Xiamen.
6 - If you also include India, Australia, and New Zealand this figure rises to 18%
7 -By comparison, even the nominal GDP of the United States is only 2.75 times larger than the combined GDP of Britain, Canada, and Australia. France’s GDP is only 3.15 times larger than that of Belgium plus Quebec. Even if you try to count the wealth of the entire Chinese global diaspora rather than just majority-Chinese economies like Taiwan, Hong Kong, and Singapore, it is very small compared to the size of mainland China’s GDP. If you assume, for simplicity’s sake, that there are 50 million “overseas Chinese” (the figure given, roughly, by Wikipedia), and that each has an average income of $25,000 (similar to the per capita GDP of Taiwan), then the overall income of the Chinese diaspora is $1.25 trillion — still little more than 10% of mainland China’s GDP.
8 - According to this source, “Chinese FDI in Japan and trade relations between the countries have a long history because of the relative cultural and geographic proximity between the countries (Alvstam et al., 2009). Also, China is one of the two most important trade partner for the Japanese economy. All this should, following the mainstream trade theories (e.g., Helpman, 1984; Helpman & Krugman, 1985; Petri, 1994), give favorable conditions for large inflows of FDI. In relative term, this picture has to some extent been correct. Before the recent territorial row over the Senkaku, or Diaoyutai, Islands located between Okinawa and Taiwan, the Chinese and Japanese mutual cross-border M&As was steadily increasing with 2010 and 2011 as peak years recording 16 M&A deals, respectively (Recof, 2012). However, this trend seems to have been broken, by recording only 6 M&As in 2012, and 5 M&As in 2013.”
Japan was not even one of China’s top 10 targets of outbound M&A between 2005-2015— the biggest target for outbound Chinese and Hong Kong M&A was Britain (14.6% of the total). By comparison, 43.7% of Japan’s outbound M&A over the past 10 years went to the US. (Source)
9- This is not to say the China’s relationships with Japan, Taiwan, or the US are nearly as troubled as many people think they are or would like them to be. Still, these relationships may mean that China has a very different outlook in foreign affairs than do many other countries.
10 - Indeed, one might expect China to account for a disproportionately large share of international trade, given its role as the ‘workshop of the world’ and its voracious appetite for imports of energy and minerals. But in fact China only accounts for about 11-12% of global trade as far as I can tell (using statistics from MIT’s Observatory of Economic Complexity), regardless of whether or not Hong Kong is included.
11- In 2014, the largest M&A deal involving an Asian country, whether cross-border or domestic, was the acquisition of China's CITIC Ltd. by Hong Kong's CITIC Pacific Ltd.; a deal that was worth about three times more than any other involving an Asian country that year. In 2015, in contrast, one of the biggest deals was, according to this article from Bloomberg, “China Cinda Asset Management's (pending) $8.8 billion purchase of Hong Kong lender Nanyang Commercial Bank and the ChemChina-led acquisition of tire maker Pirelli.” Singapore’s outbound M&A has been increasing by a huge amount in recent years too and is much higher than its inbound M&A.
12 —M&A statistics, moreso than many other economic or financial categories, tend to consider Hong Kong as being separate from the rest of the territories of the People’s Republic of China. This may be (at least partially) justified, but it can also confuse matters at times.
13 - In 2011, 2012, and 2013, Hong Kong’s outbound M&A was about 25-40% as large as mainland China’s, even though Hong Kong’s GDP is only around 2% as large as mainland China’s. Singapore’s outbound M&A, meanwhile, was 1.5-22% as large as mainland China’s during 2011, 2012, and 2013, while Singapore’s GDP was also only about 2% as large as mainland China’s. (Source: Global Finance)
(Click on image to enlarge)
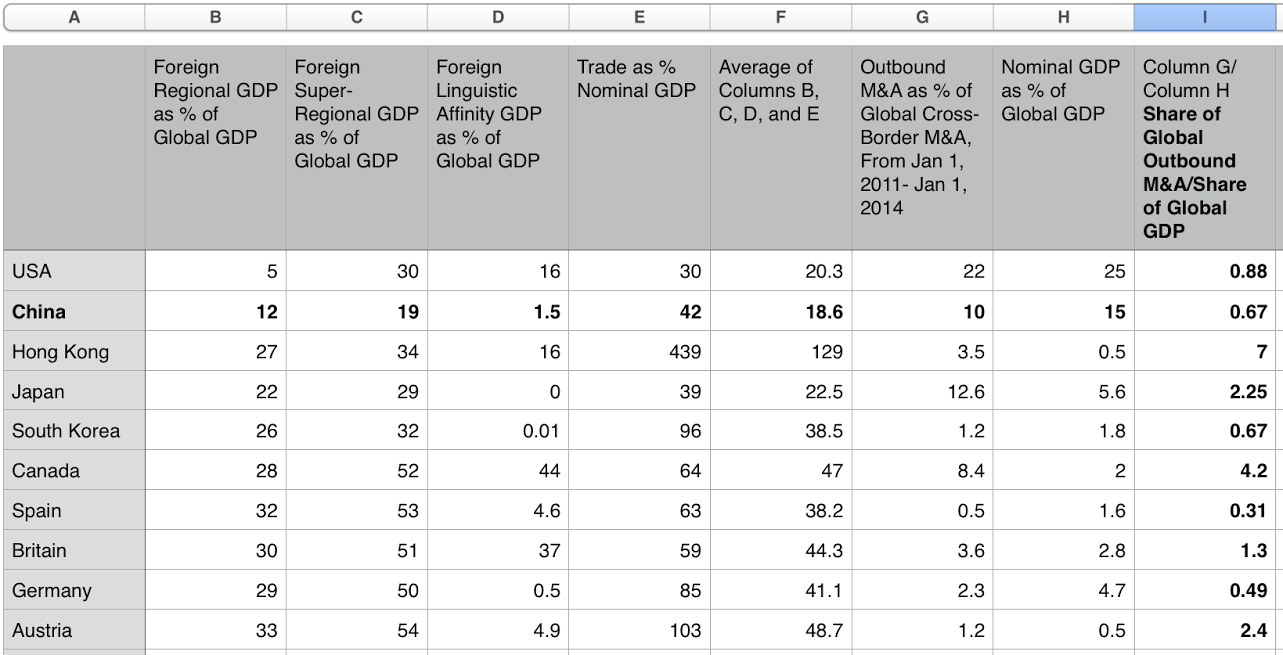
I made this chart in order to find correlations between outbound M&A activity (as given in column I, at the right end of the chart) and the factors in the four leftmost columns of the chart. Column I’s closest linear relationships are with columns E and F — though Japan is an outlier in both cases. Admittedly, though, this chart does not include enough countries or enough years of M&A to say much.
Column B is based on the regions Europe, North America, and East Asia. For example, the USA’s figure in column B is equal to the GDP of Canada plus the GDP of Mexico divided by the GDP of the world. Column C is based on two “super-regions”: the North Atlantic (including Europe and North America) and the Indo-Pacific. Column D is based on countries in which the majority language(s) is the same: China’s figure in column D, for example, is equal to the combined GDP of Taiwan, Hong Kong, and Singapore - the only other majority-Chinese economies - divided by the GDP of the world.
Disclosure: None.


