
Euro Stoxx 50 Trades At 13 Year High As Bund Yields Consolidate Near Pandemic Highs
The Euro Stoxx 50, Europe’s leading blue-chip index, has continued to grind higher in 2021. In 2020, the index had plunged by over 30% as the pandemic’s effects set in around the world. After consolidation throughout the summer and early fall around the 3,300 level, the index moved sharply higher in early November and has continued marching higher since then, with gains accelerating in 2021.
In late March 2021, the index broke above its pre-pandemic level of 3,860. It has continued to rally from there, breaking above the 4,000 level in mid-April and hitting a high around 4,040, its highest point since early 2008. Since achieving new heights, the index has pulled back slightly but has continued to trade around the 4,000 level.
EURO STOXX 50 INDEX: 1 DAY TIME FRAME (JAN. 2020 – MAY 2021)
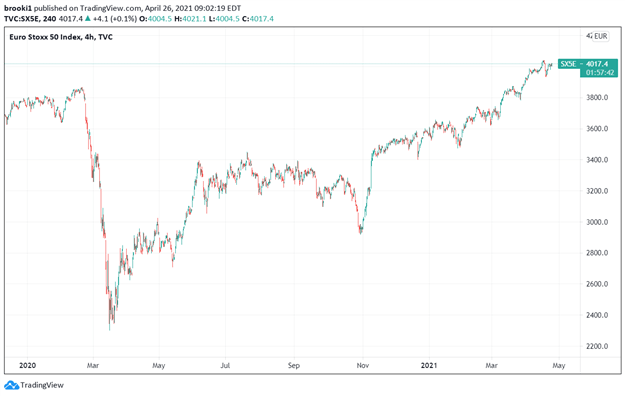
Chart created by Izaac Brook, Source: TradingView
While the Eurozone initially struggled with its vaccination efforts compared to the US, recent news has been encouraging. A ramp-up in production and distribution now has the EU’s chief vaccination leaders expecting herd immunity in the EU’s adult population by mid-July. Despite positive developments on the vaccine front, rising cases have triggered renewed lockdowns in many of the bloc’s countries, further damaging their economies.
The ECB left policy unchanged at their April meeting and has continued to stick to its guidance of increasing the pace of PEPP purchases compared to the first quarter of the year. With no changes to react to, Eurozone yields remained consistent with their pre-meeting levels.
Even before the late February volatility in bond markets, German 10yr Bund yields had made considerable gains at the mid-point of the month, jumping from -0.46% to -0.34% in a matter of days. In late February, Bund yields jumped to a pandemic high of -0.23%. After dropping back to the -0.30% level as markets settled down, yields have worked their way back upwards again. In mid-April, the 10yr Bund yield made another test at the levels set in late February, hitting the -0.23% for the second time since March of 2020.
GERMAN AND US 10YR YIELDS: 1 DAY TIME FRAME (OCT. 2019 – MAY 2021)
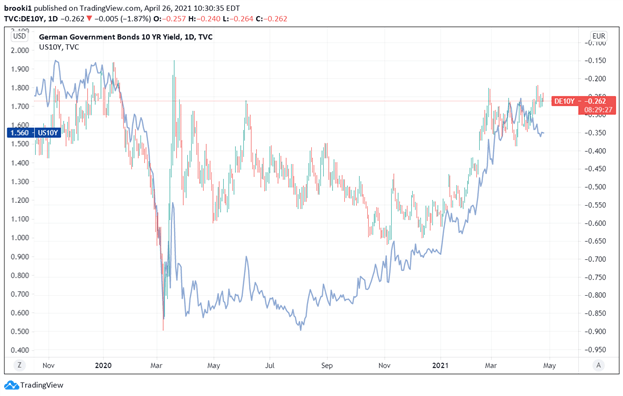
Chart created by Izaac Brook, Source: TradingView
While the moves in Bund yields have mostly tracked the moves in the US 10yr Treasury, the yields on the two have diverged in April. While the 10yr Treasury has pulled back from the highs above 1.75% to currently trade back around 1.56%, Bund yields are continuing to trade around their pandemic highs.
This slight divergence might be explained by increasing economic optimism in Europe compared to the continued optimism exhibited in the US. Continued strength in US data has likely made another stimulus bill less likely than initially thought, potentially driving a reassessment in Treasury yields as less supply is now expected. Whatever the reason, a convergence or continued divergence may send important macro signals as the global recovery gains steam.


