

Image Source: Unsplash
There was a lot of optimism for emerging markets (EM) equities heading into 2023. The long-awaited reopening of the Chinese economy was expected to bolster the country’s equities and the EM asset class more broadly. Weaker-than-expected Chinese economic data repeatedly stymied this thesis.
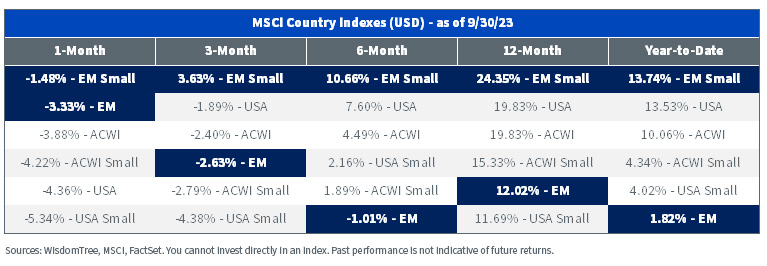
Year-to-date performance of EM equities has been mixed. On the one hand, the MSCI Emerging Markets Index returned 4.6%, lagging its developed peers. On the other hand, the MSCI Emerging Markets Small Cap Index returned 16.12%, outpacing the MSCI ACWI benchmark.
MSCI Region Index Returns
(Click on image to enlarge)
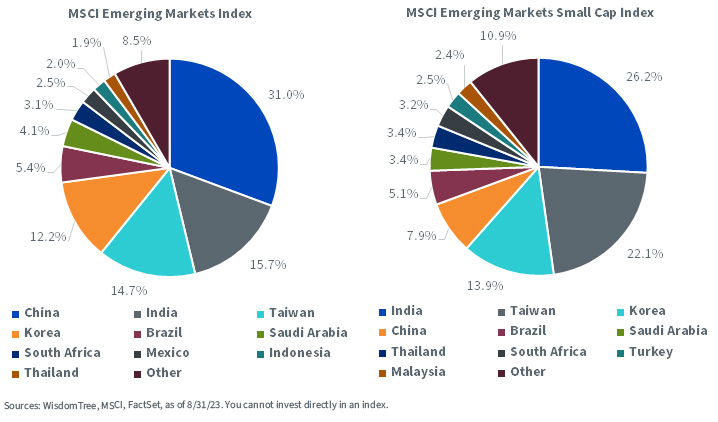
A large part of the performance differential between MSCI’s EM and EM small-cap indexes comes down to the weight of China. China makes up almost one-third of the broad EM index, more than twice the weight of the second-largest country (Taiwan). In contrast, India is the largest weight in the small-cap index and China is just the fourth-largest weight, at roughly 8%.
MSCI EM Country Weights
(Click on image to enlarge)
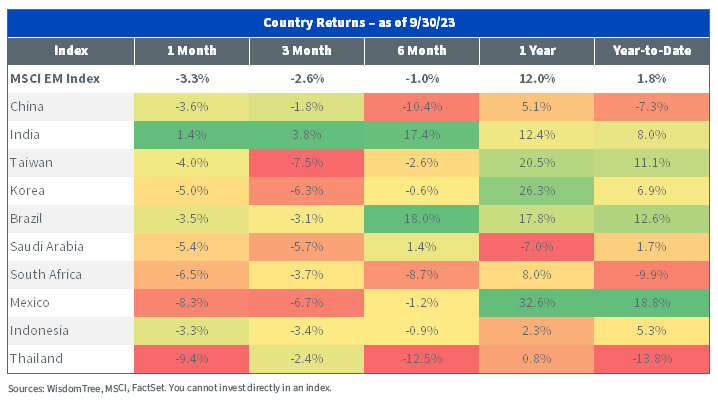
Year-to-date, China has underperformed most of its EM neighbors, returning -4.7%. Taiwan and South Korea, by comparison, returned 15.4% and 12.6%, respectively. India, the fifth-largest economy in the world and the second-largest in EM, outperformed China in all periods and notably overtook its place as the world’s most populous country in April.
MSCI EM Country Performance, Top 10 by Weight
(Click on image to enlarge)
Investors used to think an allocation to EM was another closet value allocation. No longer.
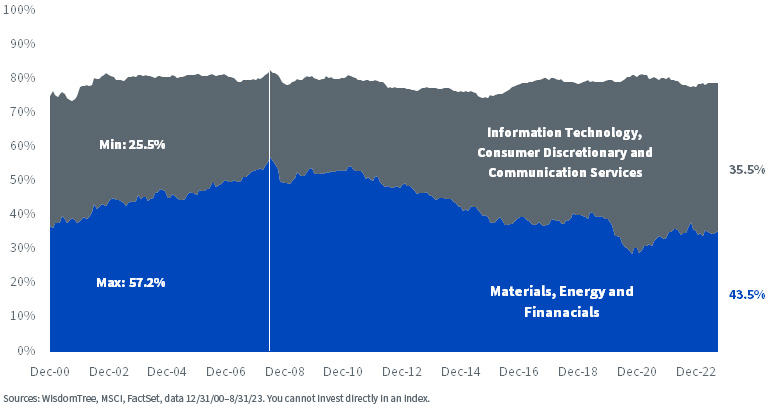
The MSCI Emerging Markets Index sector mix has changed significantly over the last two decades. In the 2000s, the index was allocated more to value-oriented sectors, such as Materials, Energy, and Financials, than to “growthier” sectors like Information Technology, Consumer Discretionary, and Communication Services.
From the second half of the 2010s onwards, the allocation reversed, largely due to the rise of tech giants in China and Taiwan cementing the region as the world’s largest producer of semiconductors.
EM Shifting Sector Composition
(Click on image to enlarge)
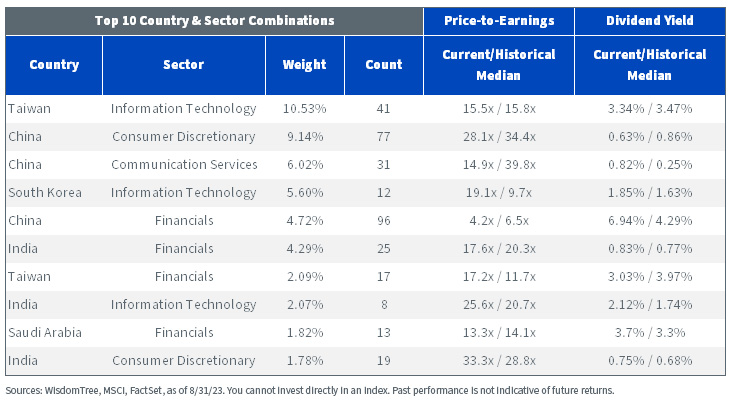
The below chart breaks down the MSCI EM Index by country-sector groupings. Some interesting takeaways here are that the Communication Services sector in China is trading at less than half its historical median valuation while yielding over triple its historical median dividends. Also, Indian Financials are trading at deep discounts while Taiwanese Financials are trading at significant premiums to their historical medians.
MSCI EM Country-Sector Combination Valuations and Yields
(Click on image to enlarge)
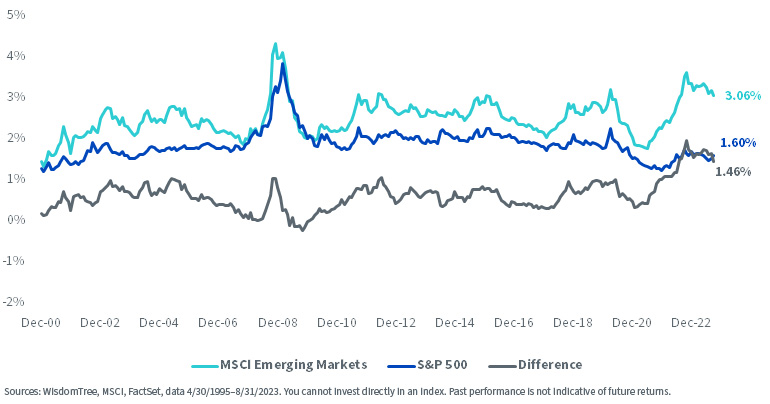
Since the late 1990s, the MSCI EM Index has had higher dividend yields than the S&P 500. The gap has widened significantly over the last three years, and the MSCI EM Index’s dividend yield is twice that of the S&P 500.
MSCI EM Dividends vs. S&P 500
(Click on image to enlarge)
China and India share several commonalities, including their large populations and statuses as global manufacturing powerhouses and tech hubs. However, the two countries have fared very differently over the last few years.
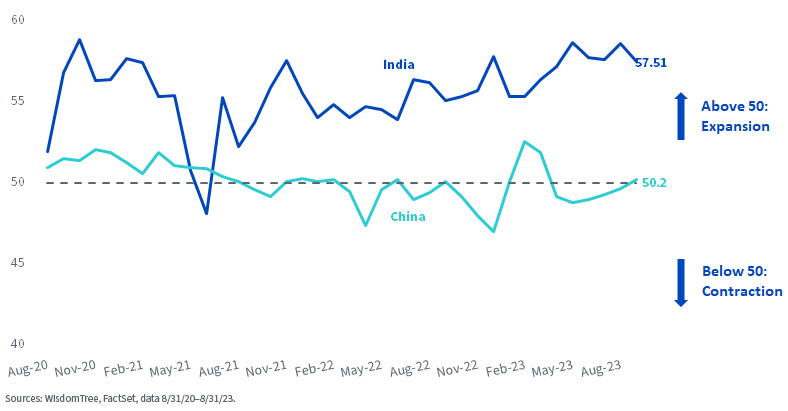
India’s manufacturing Purchasing Managers’ Index (PMI) surpassed 50 after a brief dip in late 2021 and has been rising since. China’s manufacturing PMI has remained mostly at or below 50 within the same period. It is also interesting to note that China has been cutting interest rates, and its policy rate is currently 3.5%, while India has maintained a steady 6.5%.
China vs. India PMI, Manufacturing
(Click on image to enlarge)
MSCI EM Country Policy Rates and Inflation
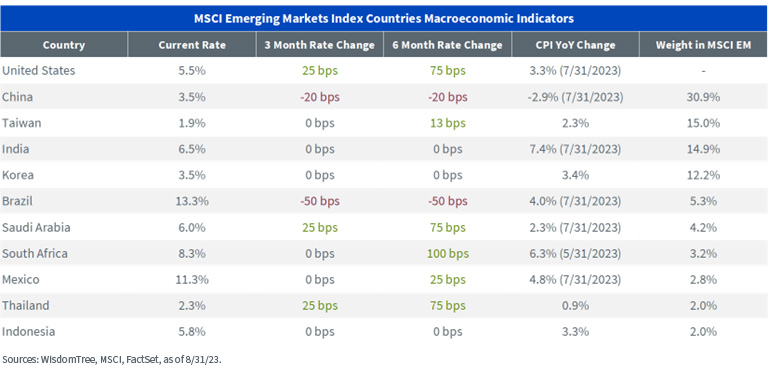
(Click on image to enlarge)
Conclusion
While many investors allocate to EM to diversify their portfolios, it is important to keep in mind that it is not a monolith and the countries and regions that comprise it have vastly different characteristics and behaviors. Tracking macroeconomic changes, equity performance, and other indicators is paramount to effectively investing in EM.
More By This Author:
Growth Stocks Are Less Expensive Than Traditional Measures Imply
China’s Reluctance Toward Stimulus-Driven Growth
What’s Driving Returns In Emerging Markets?


Comments
Log in or sign up to join the conversation.