
S&P/TSX 60 Elliott Wave Analysis Trading Lounge Day Chart
S&P/TSX 60 Elliott Wave Technical Analysis
- FUNCTION: Bullish Trend
- MODE: Impulsive
- STRUCTURE: Orange Wave 1
- POSITION: Navy Blue Wave 3
- DIRECTION NEXT LOWER DEGREES: Orange Wave 2
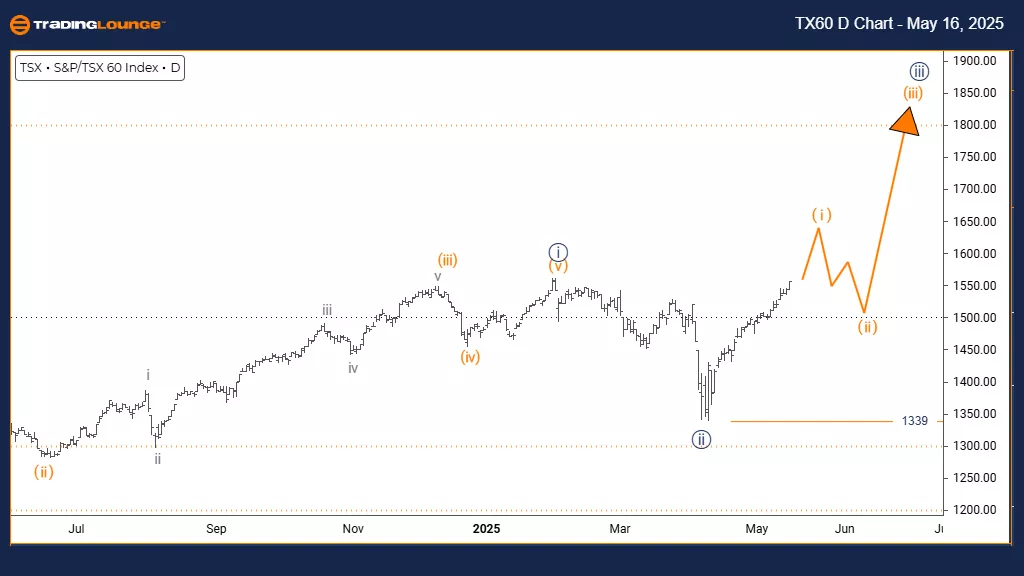
- DETAILS: Navy Blue Wave 2 appears complete, now Orange Wave 1 of 3 is active.
The daily chart for S&P/TSX 60 suggests a developing bullish pattern with an impulsive structure in place. Orange wave one is currently unfolding within a broader navy blue wave three, marking the end of navy blue wave two's corrective phase. This development indicates that the market has entered a new upward leg, with orange wave one initiating a possible larger advance.
This wave count shows the index transitioning into orange wave one’s upward movement. The impulsive structure reflects solid market momentum, pointing toward increased bullish pressure. From a trader’s standpoint, this setup indicates that the index might still have substantial upside potential before the next correction begins. The expected correction will be orange wave two following the conclusion of the current rally.
Traders should observe the price movement for confirmation of this wave’s strength and be alert for any signs that suggest wave one’s completion, signaling orange wave two’s beginning. The technical outlook supports the idea that the index remains in a strong phase of its upward cycle, likely to extend until the next minor correction.
S&P/TSX 60 Elliott Wave Analysis Trading Lounge Weekly Chart
S&P/TSX 60 Elliott Wave Technical Analysis
- FUNCTION: Bullish Trend
- MODE: Impulsive
- STRUCTURE: Navy Blue Wave 3
- POSITION: Gray Wave 2
- DIRECTION NEXT HIGHER DEGREES: Orange Wave 3 (started)
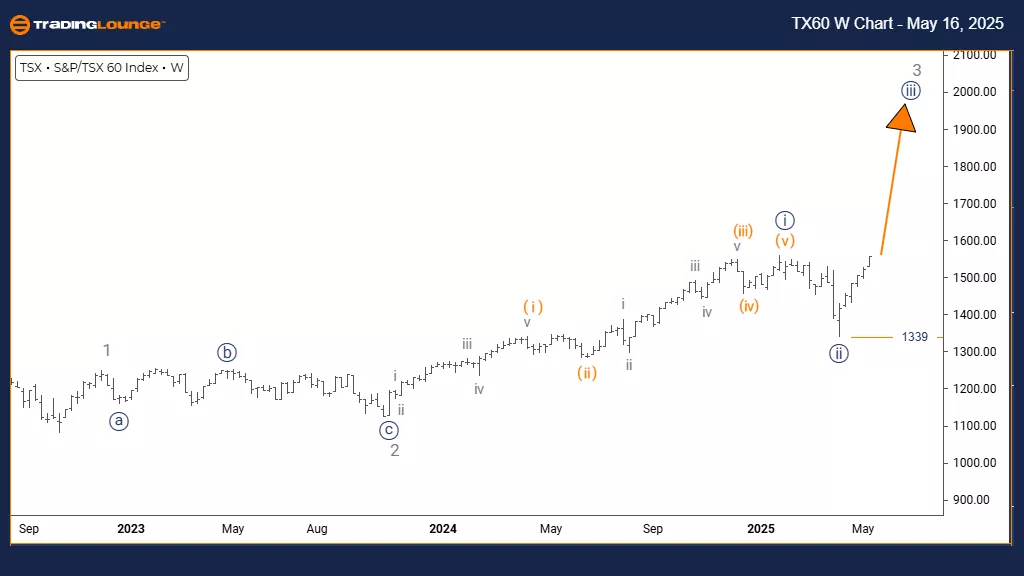
- DETAILS: Navy Blue Wave 2 appears complete, Navy Blue Wave 3 now in motion.
The weekly chart outlines a bullish structure for the S&P/TSX 60, showing impulsive traits that suggest a strong upward movement is underway. Navy blue wave three is currently progressing within the structure of gray wave two. This setup marks the end of a correction and the beginning of a potentially significant rise.
Wave two's conclusion and the activation of wave three highlight growing institutional buying interest. From a long-term technical perspective, this upward movement fits into a larger bullish trend, indicating that this wave could have considerable staying power. The position within gray wave two underscores the importance of this phase within the broader market structure.
This chart helps investors understand the long-term placement of the index within a sustained bullish cycle. Wave three, often the most robust and extended wave in an Elliott sequence, appears to be active. Market participants are encouraged to monitor ongoing price developments for further confirmation and to stay aware of signs indicating continuation or completion.
Overall, the analysis offers key insights into managing positions during a potentially prolonged bullish trend. The structure supports the possibility of continued upside, although traders should stay vigilant for any weakening that may signal a nearing end of this impulsive wave.
Technical Analyst: Malik Awais
More By This Author:
Elliott Wave Technical Analysis: Theta Token Crypto Price News For Friday, May 16
Elliott Wave Analysis & Technical Forecast: Block, Inc.
Elliott Wave Technical Analysis: Advanced Micro Devices Inc. - Thursday, May 15


Comments
Log in or sign up to join the conversation.