
DAX (Germany) Elliott Wave Analysis – Trading Lounge Day Chart
DAX (Germany) Wave Technical Analysis
- Function: Bullish Trend
- Mode: Impulsive
- Structure: Orange Wave 1
- Position: Navy Blue Wave 3
- Direction (Next Lower Degree): Orange Wave 2
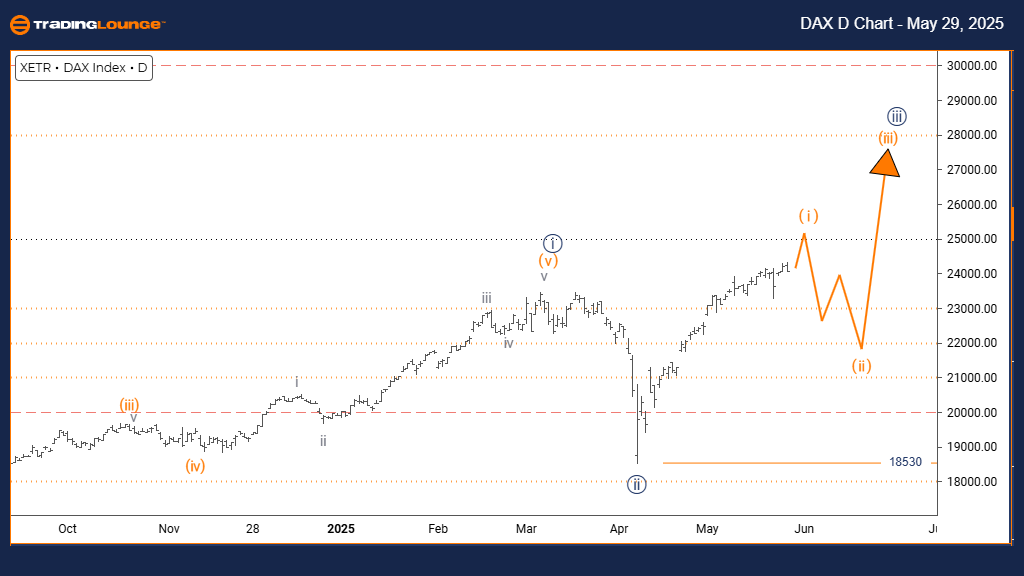
- Details: Navy Blue Wave 2 appears completed; Orange Wave 1 of 3 is now unfolding.
- Wave Invalidation Level: 18530
Technical Overview
Germany’s DAX index is showing strong upward momentum on the daily chart. The wave count indicates the formation of Orange Wave 1 within a larger Navy Blue Wave 3, confirming the end of Navy Blue Wave 2. This marks the beginning of a new impulsive upward phase, suggesting the market is in the early stages of a bullish sequence.
Market Behavior
The completed correction of Navy Blue Wave 2 transitions into Orange Wave 1’s impulse, marked by sustained buying strength. The current structure supports a bullish outlook, though any drop below 18530 would invalidate this wave count and could imply a deeper correction or trend change.
Trading Implications
This setup positions the DAX for potential gains during Orange Wave 1, which typically precedes a corrective Orange Wave 2. Traders should monitor for continuation signals and manage positions carefully, given the early phase of this bullish trend. The current wave formation emphasizes upward potential with risk controls in place.
DAX (Germany) Elliott Wave Analysis – Trading Lounge Weekly Chart
DAX (Germany) Wave Technical Analysis
- Function: Bullish Trend
- Mode: Impulsive
- Structure: Navy Blue Wave 3
- Position: Gray Wave 3
- Direction (Next Lower Degree): Navy Blue Wave 4
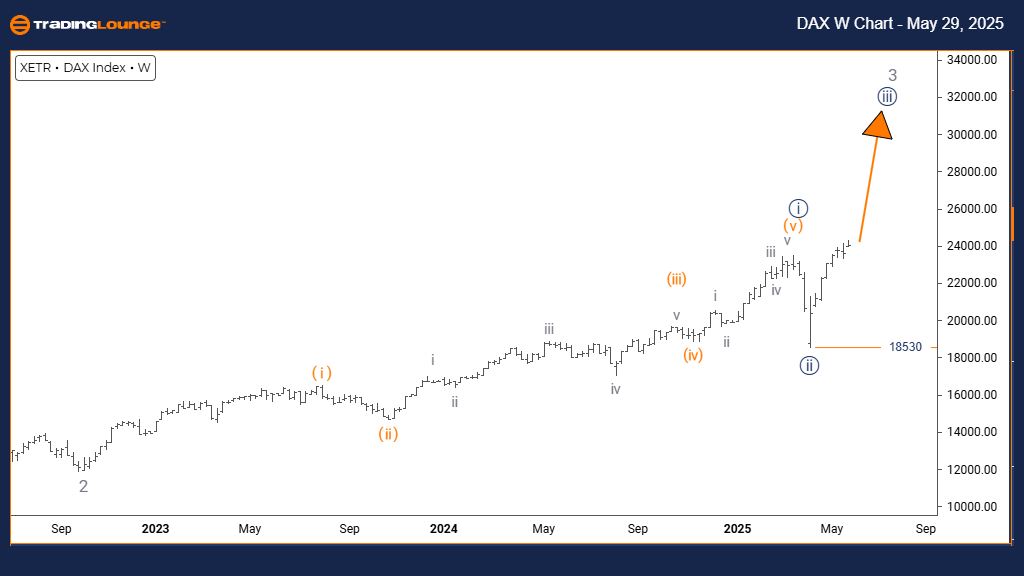
- Details: Navy Blue Wave 2 appears complete; Navy Blue Wave 3 is active.
- Wave Invalidation Level: 18530
Technical Overview
The weekly DAX chart shows an active bullish trend with Navy Blue Wave 3 progressing inside a larger Gray Wave 3. With Navy Blue Wave 2 concluded, this third wave signals a strong upward leg that often shows the greatest strength in Elliott Wave sequences.
Market Behavior
This impulsive pattern reflects dominant buying activity. The wave count suggests continued upside potential unless price falls below 18530, which would nullify the current wave setup. The structure indicates buyers remain in control during this phase.
Trading Implications
Traders should expect further upward movement as Navy Blue Wave 3 continues. However, they must stay alert for signs of an upcoming Navy Blue Wave 4, which would signal a possible correction. Position management should consider these phase shifts while monitoring key support levels.
Technical Analyst: Malik Awais
More By This Author:
Elliott Wave Technical Analysis: Ripple Crypto Price News For Thursday, May 29
Unlocking ASX Trading Success: Cochlear Limited - Wednesday, May 28
Elliott Wave Technical Analysis: Caterpillar Inc. - Wednesday, May 28


Comments
Log in or sign up to join the conversation.