
Here are the latest charts and statistics for the Commitment of Traders (COT) data published by the Commodities Futures Trading Commission (CFTC).
The latest COT data is updated through Tuesday March 22nd and shows a quick view of how large traders (for-profit speculators and commercial entities) were positioned in the futures markets. All currency positions are in direct relation to the US dollar where, for example, a bet for the euro is a bet that the euro will rise versus the dollar while a bet against the euro will be a bet that the euro will decline versus the dollar.
Highlighting the COT currency data was the sharp pullback in the Canadian dollar currency futures contracts. Canadian dollar speculators cut back on their bullish bets by a total of -22,680 contracts, the largest change among currencies this week and one week after CAD saw bullish bets rise by over +10,000 contracts (bringing the speculator standing to a six-week high). This week’s decline dropped the total net speculator standing back into bearish territory (-4,940 contracts) for the first time in the past ten weeks, dating back to January 11th. The major commodity currencies (Canadian dollar, Australian dollar and New Zealand dollar) all saw pullbacks in their speculator bets this week after strong rises last week.
The only currency markets with higher speculator bets this week were the US Dollar Index (1,255 contracts) and the Euro (5,049 contracts).
The currencies with declining bets were the Japanese yen (-16,142 contracts), Brazil real (-2,599 contracts), Swiss franc (-3,195 contracts), British pound sterling (-8,183 contracts), New Zealand dollar (-1,133 contracts), Canadian dollar (-22,680 contracts), Russian ruble (-263 contracts) and Bitcoin (-190 contracts).
Data Snapshot of Forex Market Traders | Columns Legend
| EUR | 658,817 | 66 | 23,843 | 42 | -46,378 | 63 | 22,535 | 12 |
| JPY | 248,221 | 87 | -78,482 | 18 | 104,790 | 88 | -26,308 | 0 |
| GBP | 195,712 | 36 | -37,244 | 47 | 50,390 | 59 | -13,146 | 28 |
| MXN | 134,766 | 19 | -18,051 | 20 | 13,919 | 79 | 4,132 | 61 |
| AUD | 127,767 | 28 | -51,189 | 37 | 48,388 | 55 | 2,801 | 59 |
| CAD | 124,090 | 13 | -4,940 | 43 | -7,565 | 54 | 12,505 | 55 |
| BRL | 70,832 | 68 | 41,564 | 91 | -44,463 | 8 | 2,899 | 100 |
| USD Index | 51,952 | 72 | 29,635 | 77 | -33,521 | 19 | 3,886 | 59 |
| CHF | 44,911 | 21 | -8,424 | 55 | 20,499 | 54 | -12,075 | 28 |
| NZD | 35,256 | 15 | 2,520 | 75 | -2,069 | 27 | -451 | 47 |
| RUB | 20,930 | 4 | 7,543 | 31 | -7,150 | 69 | -393 | 24 |
| Bitcoin | 11,274 | 61 | 0 | 94 | -481 | 0 | 481 | 24 |
US Dollar Index Futures:
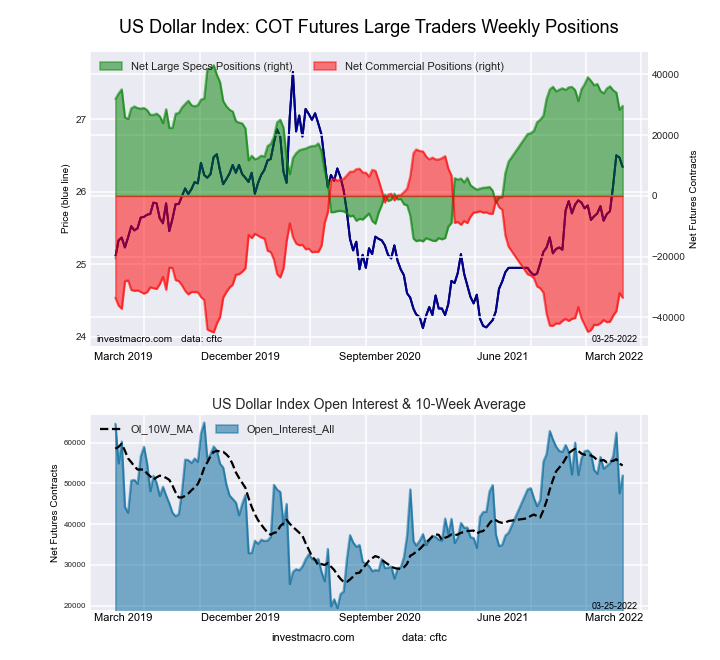
The US Dollar Index large speculator standing this week resulted in a net position of 29,635 contracts in the data reported through Tuesday. This was a weekly lift of 1,255 contracts from the previous week which had a total of 28,380 net contracts.
This week’s current strength score (the trader positioning range over the past three years, measured from 0 to 100) shows the speculators are currently Bullish with a score of 76.9 percent. The commercials are Bearish-Extreme with a score of 18.9 percent and the small traders (not shown in chart) are Bullish with a score of 59.0 percent.
| US DOLLAR INDEX Statistics | SPECULATORS | COMMERCIALS | SMALL TRADERS |
| – Percent of Open Interest Longs: | 83.8 | 3.2 | 10.5 |
| – Percent of Open Interest Shorts: | 26.8 | 67.7 | 3.0 |
| – Net Position: | 29,635 | -33,521 | 3,886 |
| – Gross Longs: | 43,561 | 1,665 | 5,434 |
| – Gross Shorts: | 13,926 | 35,186 | 1,548 |
| – Long to Short Ratio: | 3.1 to 1 | 0.0 to 1 | 3.5 to 1 |
| NET POSITION TREND: | |||
| – Strength Index Score (3 Year Range Pct): | 76.9 | 18.9 | 59.0 |
| – Strength Index Reading (3 Year Range): | Bullish | Bearish-Extreme | Bullish |
| NET POSITION MOVEMENT INDEX: | |||
| – 6-Week Change in Strength Index: | -7.1 | 12.1 | -34.7 |
Euro Currency Futures:
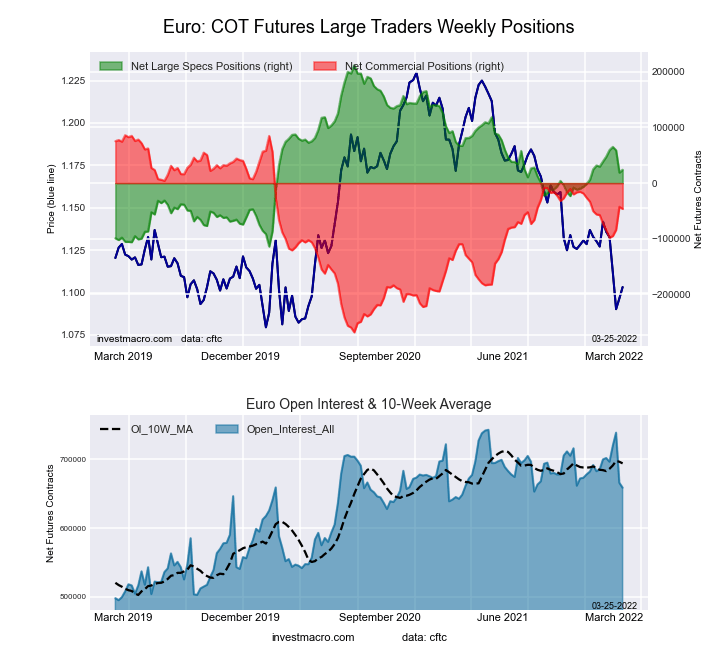
The Euro Currency large speculator standing this week resulted in a net position of 23,843 contracts in the data reported through Tuesday. This was a weekly boost of 5,049 contracts from the previous week which had a total of 18,794 net contracts.
This week’s current strength score (the trader positioning range over the past three years, measured from 0 to 100) shows the speculators are currently Bearish with a score of 42.3 percent. The commercials are Bullish with a score of 62.6 percent and the small traders (not shown in chart) are Bearish-Extreme with a score of 11.7 percent.
| EURO Currency Statistics | SPECULATORS | COMMERCIALS | SMALL TRADERS |
| – Percent of Open Interest Longs: | 31.4 | 54.3 | 11.5 |
| – Percent of Open Interest Shorts: | 27.8 | 61.3 | 8.1 |
| – Net Position: | 23,843 | -46,378 | 22,535 |
| – Gross Longs: | 207,051 | 357,492 | 75,970 |
| – Gross Shorts: | 183,208 | 403,870 | 53,435 |
| – Long to Short Ratio: | 1.1 to 1 | 0.9 to 1 | 1.4 to 1 |
| NET POSITION TREND: | |||
| – Strength Index Score (3 Year Range Pct): | 42.3 | 62.6 | 11.7 |
| – Strength Index Reading (3 Year Range): | Bearish | Bullish | Bearish-Extreme |
| NET POSITION MOVEMENT INDEX: | |||
| – 6-Week Change in Strength Index: | -4.6 | 7.6 | -19.7 |
British Pound Sterling Futures:
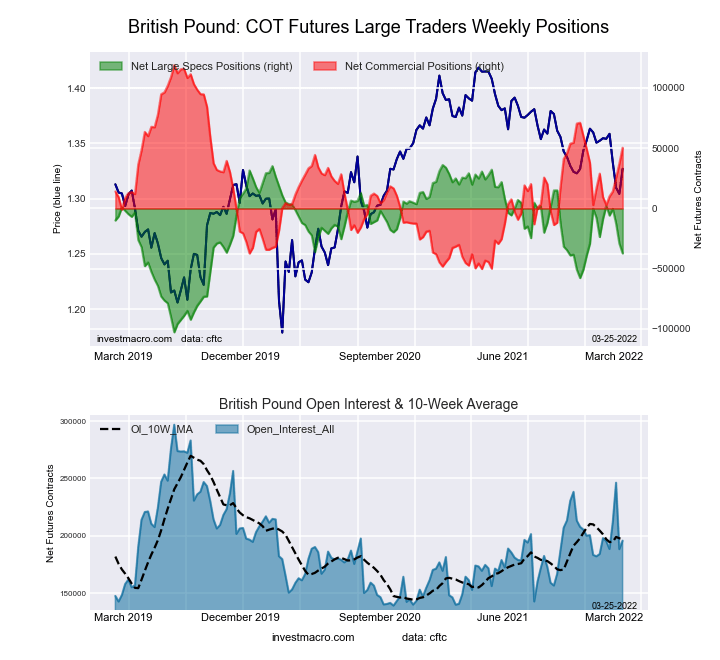
The British Pound Sterling large speculator standing this week resulted in a net position of -37,244 contracts in the data reported through Tuesday. This was a weekly fall of -8,183 contracts from the previous week which had a total of -29,061 net contracts.
This week’s current strength score (the trader positioning range over the past three years, measured from 0 to 100) shows the speculators are currently Bearish with a score of 47.2 percent. The commercials are Bullish with a score of 59.5 percent and the small traders (not shown in chart) are Bearish with a score of 28.4 percent.
| BRITISH POUND Statistics | SPECULATORS | COMMERCIALS | SMALL TRADERS |
| – Percent of Open Interest Longs: | 16.7 | 70.4 | 9.9 |
| – Percent of Open Interest Shorts: | 35.8 | 44.7 | 16.6 |
| – Net Position: | -37,244 | 50,390 | -13,146 |
| – Gross Longs: | 32,753 | 137,829 | 19,316 |
| – Gross Shorts: | 69,997 | 87,439 | 32,462 |
| – Long to Short Ratio: | 0.5 to 1 | 1.6 to 1 | 0.6 to 1 |
| NET POSITION TREND: | |||
| – Strength Index Score (3 Year Range Pct): | 47.2 | 59.5 | 28.4 |
| – Strength Index Reading (3 Year Range): | Bearish | Bullish | Bearish |
| NET POSITION MOVEMENT INDEX: | |||
| – 6-Week Change in Strength Index: | -20.7 | 24.3 | -25.6 |
Japanese Yen Futures:
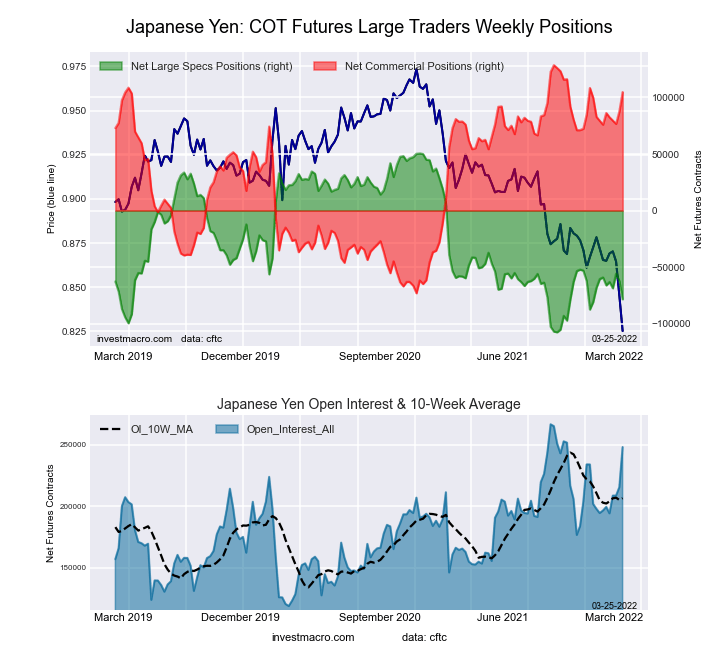
The Japanese Yen large speculator standing this week resulted in a net position of -78,482 contracts in the data reported through Tuesday. This was a weekly fall of -16,142 contracts from the previous week which had a total of -62,340 net contracts.
This week’s current strength score (the trader positioning range over the past three years, measured from 0 to 100) shows the speculators are currently Bearish-Extreme with a score of 18.4 percent. The commercials are Bullish-Extreme with a score of 88.2 percent and the small traders (not shown in chart) are Bearish-Extreme with a score of 0.0 percent.
| JAPANESE YEN Statistics | SPECULATORS | COMMERCIALS | SMALL TRADERS |
| – Percent of Open Interest Longs: | 14.8 | 76.2 | 7.2 |
| – Percent of Open Interest Shorts: | 46.4 | 34.0 | 17.7 |
| – Net Position: | -78,482 | 104,790 | -26,308 |
| – Gross Longs: | 36,676 | 189,100 | 17,749 |
| – Gross Shorts: | 115,158 | 84,310 | 44,057 |
| – Long to Short Ratio: | 0.3 to 1 | 2.2 to 1 | 0.4 to 1 |
| NET POSITION TREND: | |||
| – Strength Index Score (3 Year Range Pct): | 18.4 | 88.2 | 0.0 |
| – Strength Index Reading (3 Year Range): | Bearish-Extreme | Bullish-Extreme | Bearish-Extreme |
| NET POSITION MOVEMENT INDEX: | |||
| – 6-Week Change in Strength Index: | -12.2 | 14.3 | -19.3 |
Swiss Franc Futures:
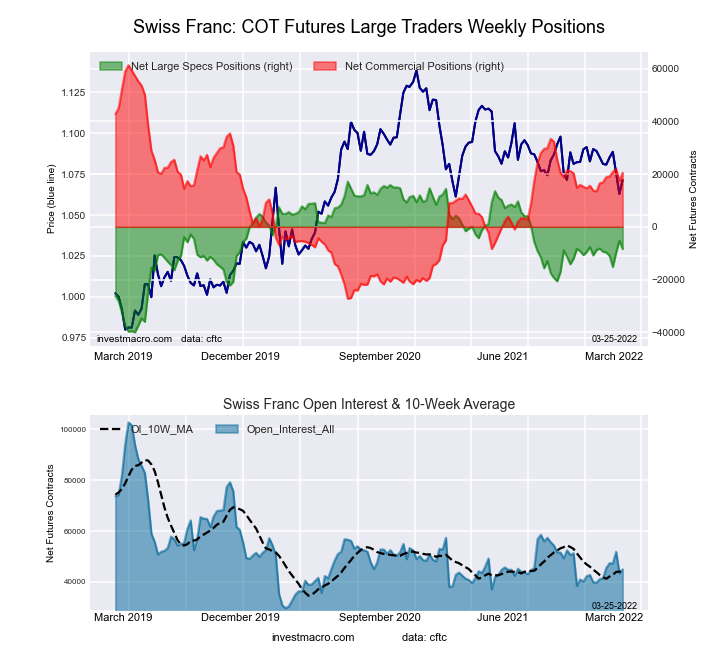
The Swiss Franc large speculator standing this week resulted in a net position of -8,424 contracts in the data reported through Tuesday. This was a weekly lowering of -3,195 contracts from the previous week which had a total of -5,229 net contracts.
This week’s current strength score (the trader positioning range over the past three years, measured from 0 to 100) shows the speculators are currently Bullish with a score of 55.2 percent. The commercials are Bullish with a score of 53.9 percent and the small traders (not shown in chart) are Bearish with a score of 27.9 percent.
| SWISS FRANC Statistics | SPECULATORS | COMMERCIALS | SMALL TRADERS |
| – Percent of Open Interest Longs: | 13.4 | 68.3 | 18.1 |
| – Percent of Open Interest Shorts: | 32.1 | 22.6 | 45.0 |
| – Net Position: | -8,424 | 20,499 | -12,075 |
| – Gross Longs: | 6,012 | 30,663 | 8,143 |
| – Gross Shorts: | 14,436 | 10,164 | 20,218 |
| – Long to Short Ratio: | 0.4 to 1 | 3.0 to 1 | 0.4 to 1 |
| NET POSITION TREND: | |||
| – Strength Index Score (3 Year Range Pct): | 55.2 | 53.9 | 27.9 |
| – Strength Index Reading (3 Year Range): | Bullish | Bullish | Bearish |
| NET POSITION MOVEMENT INDEX: | |||
| – 6-Week Change in Strength Index: | 1.7 | 4.0 | -13.4 |
Canadian Dollar Futures:
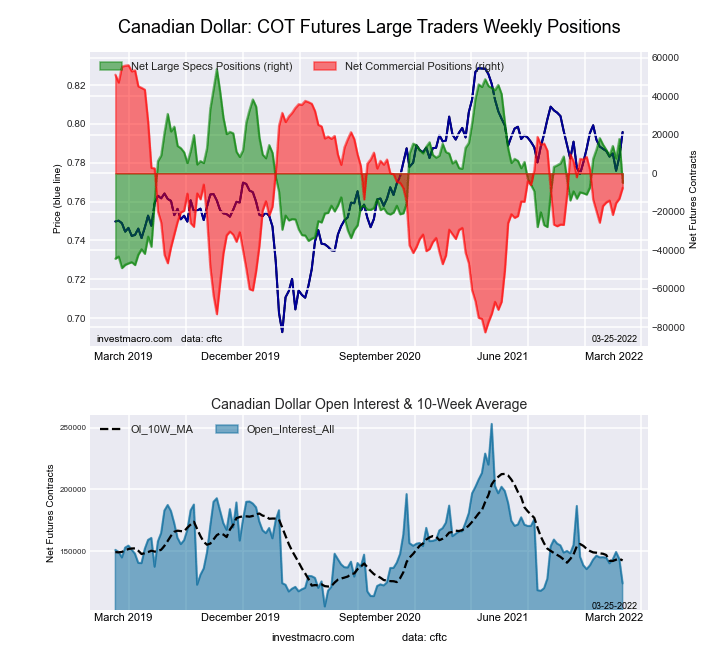
The Canadian Dollar large speculator standing this week resulted in a net position of -4,940 contracts in the data reported through Tuesday. This was a weekly lowering of -22,680 contracts from the previous week which had a total of 17,740 net contracts.
This week’s current strength score (the trader positioning range over the past three years, measured from 0 to 100) shows the speculators are currently Bearish with a score of 42.9 percent. The commercials are Bullish with a score of 54.1 percent and the small traders (not shown in chart) are Bullish with a score of 54.7 percent.
| CANADIAN DOLLAR Statistics | SPECULATORS | COMMERCIALS | SMALL TRADERS |
| – Percent of Open Interest Longs: | 23.6 | 47.8 | 26.9 |
| – Percent of Open Interest Shorts: | 27.6 | 53.9 | 16.8 |
| – Net Position: | -4,940 | -7,565 | 12,505 |
| – Gross Longs: | 29,314 | 59,269 | 33,406 |
| – Gross Shorts: | 34,254 | 66,834 | 20,901 |
| – Long to Short Ratio: | 0.9 to 1 | 0.9 to 1 | 1.6 to 1 |
| NET POSITION TREND: | |||
| – Strength Index Score (3 Year Range Pct): | 42.9 | 54.1 | 54.7 |
| – Strength Index Reading (3 Year Range): | Bearish | Bullish | Bullish |
| NET POSITION MOVEMENT INDEX: | |||
| – 6-Week Change in Strength Index: | -19.2 | 6.8 | 20.8 |
Australian Dollar Futures:
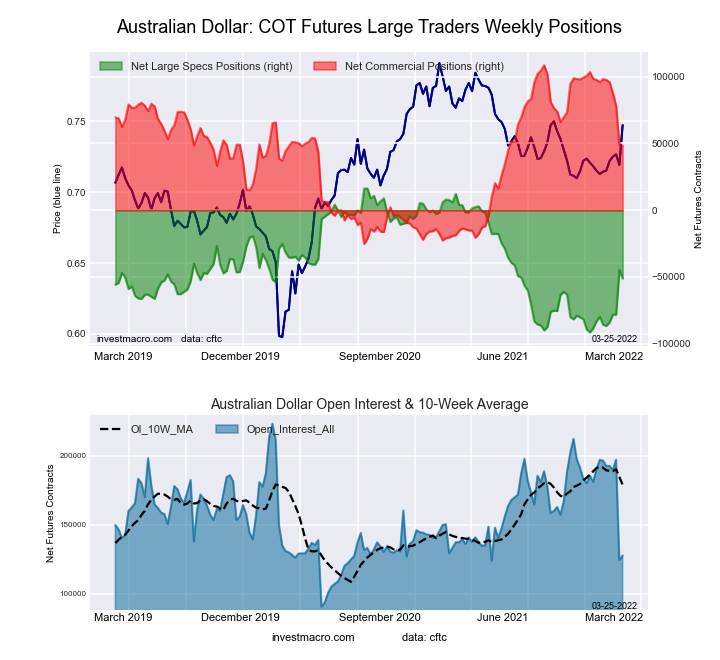
The Australian Dollar large speculator standing this week resulted in a net position of -51,189 contracts in the data reported through Tuesday. This was a weekly decline of -6,333 contracts from the previous week which had a total of -44,856 net contracts.
This week’s current strength score (the trader positioning range over the past three years, measured from 0 to 100) shows the speculators are currently Bearish with a score of 37.4 percent. The commercials are Bullish with a score of 55.0 percent and the small traders (not shown in chart) are Bullish with a score of 59.3 percent.
| AUSTRALIAN DOLLAR Statistics | SPECULATORS | COMMERCIALS | SMALL TRADERS |
| – Percent of Open Interest Longs: | 18.6 | 59.4 | 20.0 |
| – Percent of Open Interest Shorts: | 58.7 | 21.5 | 17.8 |
| – Net Position: | -51,189 | 48,388 | 2,801 |
| – Gross Longs: | 23,747 | 75,916 | 25,508 |
| – Gross Shorts: | 74,936 | 27,528 | 22,707 |
| – Long to Short Ratio: | 0.3 to 1 | 2.8 to 1 | 1.1 to 1 |
| NET POSITION TREND: | |||
| – Strength Index Score (3 Year Range Pct): | 37.4 | 55.0 | 59.3 |
| – Strength Index Reading (3 Year Range): | Bearish | Bullish | Bullish |
| NET POSITION MOVEMENT INDEX: | |||
| – 6-Week Change in Strength Index: | 32.0 | -37.3 | 37.6 |
New Zealand Dollar Futures:
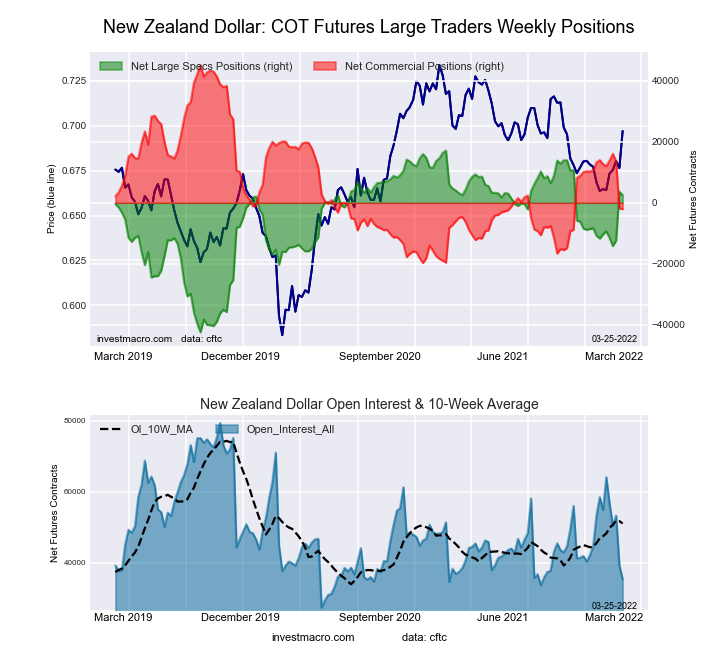
The New Zealand Dollar large speculator standing this week resulted in a net position of 2,520 contracts in the data reported through Tuesday. This was a weekly fall of -1,133 contracts from the previous week which had a total of 3,653 net contracts.
This week’s current strength score (the trader positioning range over the past three years, measured from 0 to 100) shows the speculators are currently Bullish with a score of 75.5 percent. The commercials are Bearish with a score of 27.2 percent and the small traders (not shown in chart) are Bearish with a score of 46.7 percent.
| NEW ZEALAND DOLLAR Statistics | SPECULATORS | COMMERCIALS | SMALL TRADERS |
| – Percent of Open Interest Longs: | 48.7 | 40.4 | 9.5 |
| – Percent of Open Interest Shorts: | 41.5 | 46.2 | 10.7 |
| – Net Position: | 2,520 | -2,069 | -451 |
| – Gross Longs: | 17,156 | 14,227 | 3,339 |
| – Gross Shorts: | 14,636 | 16,296 | 3,790 |
| – Long to Short Ratio: | 1.2 to 1 | 0.9 to 1 | 0.9 to 1 |
| NET POSITION TREND: | |||
| – Strength Index Score (3 Year Range Pct): | 75.5 | 27.2 | 46.7 |
| – Strength Index Reading (3 Year Range): | Bullish | Bearish | Bearish |
| NET POSITION MOVEMENT INDEX: | |||
| – 6-Week Change in Strength Index: | 21.6 | -22.8 | 21.9 |
Mexican Peso Futures:
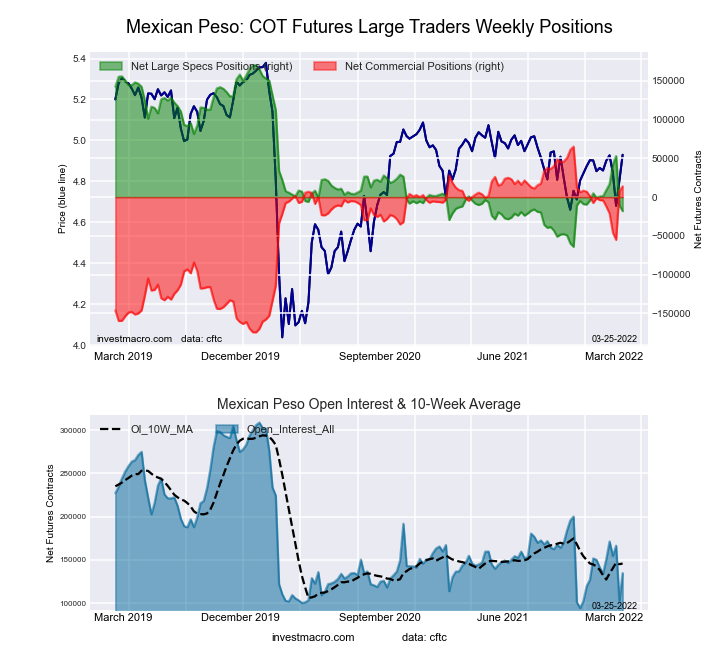
The Mexican Peso large speculator standing this week resulted in a net position of -18,051 contracts in the data reported through Tuesday. This was a weekly reduction of -7,475 contracts from the previous week which had a total of -10,576 net contracts.
This week’s current strength score (the trader positioning range over the past three years, measured from 0 to 100) shows the speculators are currently Bearish-Extreme with a score of 19.6 percent. The commercials are Bullish with a score of 78.6 percent and the small traders (not shown in chart) are Bullish with a score of 60.5 percent.
| MEXICAN PESO Statistics | SPECULATORS | COMMERCIALS | SMALL TRADERS |
| – Percent of Open Interest Longs: | 43.1 | 51.1 | 5.1 |
| – Percent of Open Interest Shorts: | 56.5 | 40.8 | 2.0 |
| – Net Position: | -18,051 | 13,919 | 4,132 |
| – Gross Longs: | 58,150 | 68,880 | 6,851 |
| – Gross Shorts: | 76,201 | 54,961 | 2,719 |
| – Long to Short Ratio: | 0.8 to 1 | 1.3 to 1 | 2.5 to 1 |
| NET POSITION TREND: | |||
| – Strength Index Score (3 Year Range Pct): | 19.6 | 78.6 | 60.5 |
| – Strength Index Reading (3 Year Range): | Bearish-Extreme | Bullish | Bullish |
| NET POSITION MOVEMENT INDEX: | |||
| – 6-Week Change in Strength Index: | -8.2 | 7.5 | 5.5 |
Brazilian Real Futures:
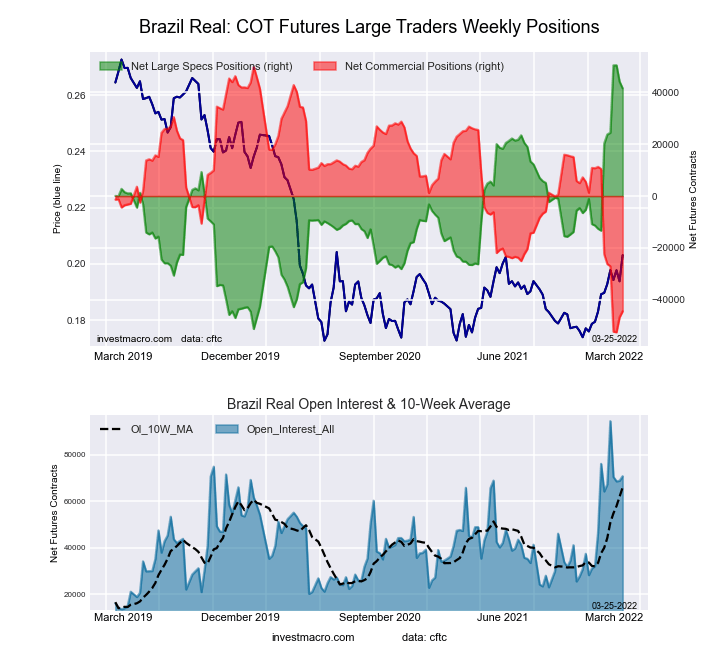
The Brazilian Real large speculator standing this week resulted in a net position of 41,564 contracts in the data reported through Tuesday. This was a weekly fall of -2,599 contracts from the previous week which had a total of 44,163 net contracts.
This week’s current strength score (the trader positioning range over the past three years, measured from 0 to 100) shows the speculators are currently Bullish-Extreme with a score of 91.2 percent. The commercials are Bearish-Extreme with a score of 7.9 percent and the small traders (not shown in chart) are Bullish-Extreme with a score of 100.0 percent.
| BRAZIL REAL Statistics | SPECULATORS | COMMERCIALS | SMALL TRADERS |
| – Percent of Open Interest Longs: | 77.6 | 15.3 | 6.8 |
| – Percent of Open Interest Shorts: | 19.0 | 78.1 | 2.8 |
| – Net Position: | 41,564 | -44,463 | 2,899 |
| – Gross Longs: | 55,001 | 10,863 | 4,851 |
| – Gross Shorts: | 13,437 | 55,326 | 1,952 |
| – Long to Short Ratio: | 4.1 to 1 | 0.2 to 1 | 2.5 to 1 |
| NET POSITION TREND: | |||
| – Strength Index Score (3 Year Range Pct): | 91.2 | 7.9 | 100.0 |
| – Strength Index Reading (3 Year Range): | Bullish-Extreme | Bearish-Extreme | Bullish-Extreme |
| NET POSITION MOVEMENT INDEX: | |||
| – 6-Week Change in Strength Index: | 20.9 | -21.5 | 8.5 |
Russian Ruble Futures:
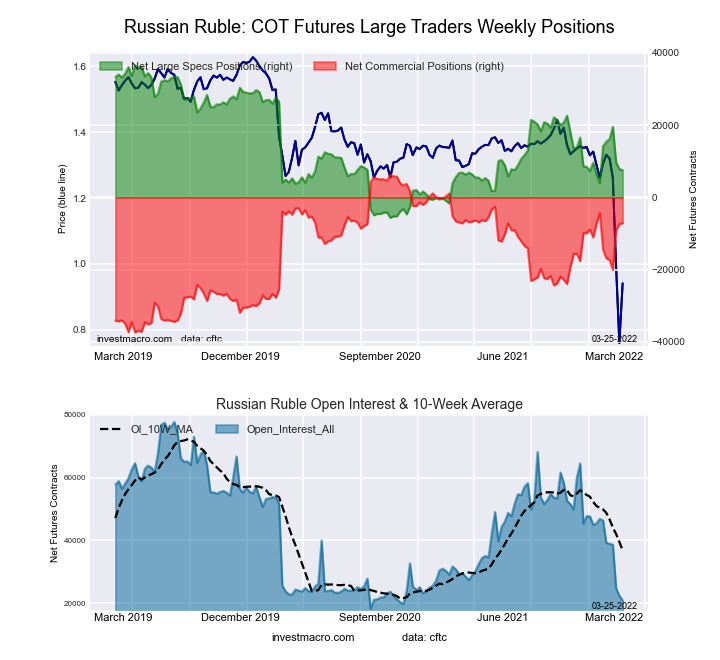
The Russian Ruble large speculator standing this week resulted in a net position of 7,543 contracts in the data reported through Tuesday. This was a weekly decline of -263 contracts from the previous week which had a total of 7,806 net contracts.
This week’s current strength score (the trader positioning range over the past three years, measured from 0 to 100) shows the speculators are currently Bearish with a score of 31.2 percent. The commercials are Bullish with a score of 69.1 percent and the small traders (not shown in chart) are Bearish with a score of 23.9 percent.
| RUSSIAN RUBLE Statistics | SPECULATORS | COMMERCIALS | SMALL TRADERS |
| – Percent of Open Interest Longs: | 36.6 | 60.6 | 2.8 |
| – Percent of Open Interest Shorts: | 0.5 | 94.7 | 4.7 |
| – Net Position: | 7,543 | -7,150 | -393 |
| – Gross Longs: | 7,658 | 12,679 | 593 |
| – Gross Shorts: | 115 | 19,829 | 986 |
| – Long to Short Ratio: | 66.6 to 1 | 0.6 to 1 | 0.6 to 1 |
| NET POSITION TREND: | |||
| – Strength Index Score (3 Year Range Pct): | 31.2 | 69.1 | 23.9 |
| – Strength Index Reading (3 Year Range): | Bearish | Bullish | Bearish |
| NET POSITION MOVEMENT INDEX: | |||
| – 6-Week Change in Strength Index: | -15.6 | 16.7 | -18.8 |
Bitcoin Futures:
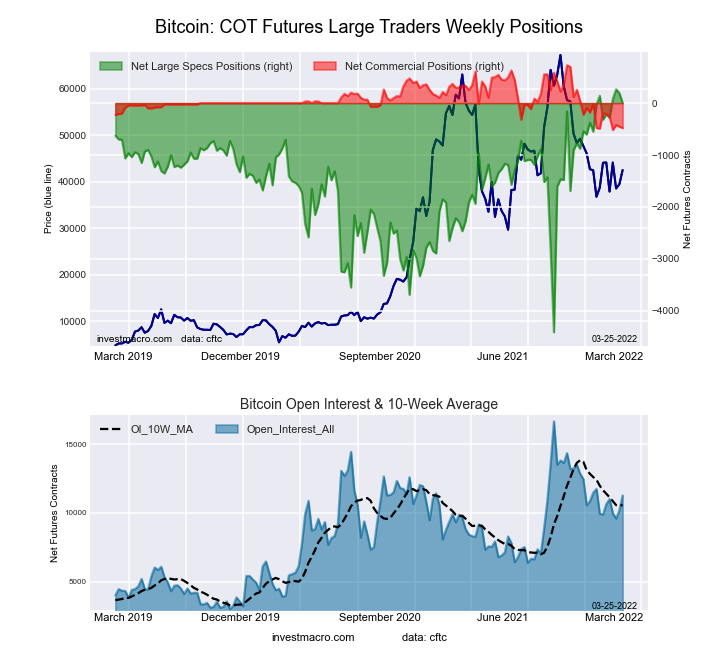
The Bitcoin large speculator standing this week resulted in a net position of 0 contracts in the data reported through Tuesday. This was a weekly lowering of -190 contracts from the previous week which had a total of 190 net contracts.
This week’s current strength score (the trader positioning range over the past three years, measured from 0 to 100) shows the speculators are currently Bullish-Extreme with a score of 94.3 percent. The commercials are Bearish-Extreme with a score of 2.9 percent and the small traders (not shown in chart) are Bearish with a score of 23.9 percent.
| BITCOIN Statistics | SPECULATORS | COMMERCIALS | SMALL TRADERS |
| – Percent of Open Interest Longs: | 74.7 | 2.9 | 11.2 |
| – Percent of Open Interest Shorts: | 74.7 | 7.2 | 6.9 |
| – Net Position: | 0 | -481 | 481 |
| – Gross Longs: | 8,425 | 326 | 1,263 |
| – Gross Shorts: | 8,425 | 807 | 782 |
| – Long to Short Ratio: | 1.0 to 1 | 0.4 to 1 | 1.6 to 1 |
| NET POSITION TREND: | |||
| – Strength Index Score (3 Year Range Pct): | 94.3 | 2.9 | 23.9 |
| – Strength Index Reading (3 Year Range): | Bullish-Extreme | Bearish-Extreme | Bearish |
| NET POSITION MOVEMENT INDEX: | |||
| – 6-Week Change in Strength Index: | 6.8 | -23.4 | -0.6 |
*COT Report: The COT data, released weekly to the public each Friday, is updated through the most recent Tuesday (data is 3 days old) and shows a quick view of how large speculators or non-commercials (for-profit traders) were positioned in the futures markets.
The CFTC categorizes trader positions according to commercial hedgers (traders who use futures contracts for hedging as part of the business), non-commercials (large traders who speculate to realize trading profits) and nonreportable traders (usually small traders/speculators) as well as their open interest (contracts open in the market at time of reporting).See CFTC criteria here.


Comments
Log in or sign up to join the conversation.