
Currency Speculators Boost Their British Pound Bets To Highest Since 2007
Here are the latest charts and statistics for the Commitment of Traders (COT) data published by the Commodities Futures Trading Commission (CFTC).
The latest COT data is updated through Tuesday July 9th and shows a quick view of how large market participants (for-profit speculators and commercial traders) were positioned in the futures markets. All currency positions are in direct relation to the US dollar where, for example, a bet for the euro is a bet that the euro will rise versus the dollar while a bet against the euro will be a bet that the euro will decline versus the dollar.
Weekly Speculator Changes led by British Pound & Australian Dollar
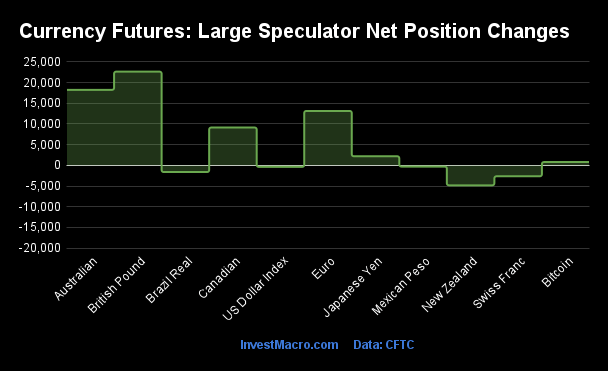
The COT currency market speculator bets were higher this week as six out of the eleven currency markets we cover had higher positioning while the other five markets had lower speculator contracts.
Leading the gains for the currency markets was the British Pound (22,649 contracts) with the Australian Dollar (18,249 contracts), the EuroFX (13,142 contracts), the Canadian Dollar (9,140 contracts), the Japanese Yen (2,190 contracts) and Bitcoin (794 contracts) also showing positive weeks.
The currencies seeing declines in speculator bets on the week were the New Zealand Dollar (-4,831 contracts), the Swiss Franc (-2,645 contracts), the Brazilian Real (-1,624 contracts), the US Dollar Index (-374 contracts) and with the Mexican Peso (-304 contracts) also seeing lower bets on the week.
Currency Speculators boost their British Pound bets to highest since 2007
Highlighting this week’s COT currency data is the strong gains in the speculator positioning for the British Pound Sterling (GBP). The Pound Sterling speculative positioning increased this week for a second straight week – jumping by a total of +22,649 contracts following last week’s +17,993 contract gain.
The GBP speculator position has risen for the eighth time out of the past ten weeks for a ten-week gain of +113,680 contracts that has taken the net standing from a total of -28,990 contracts on April 30th to a total of +84,690 contracts this week.
The GBP speculator position is now at the most bullish level in the past 886 weeks, dating back all the way to July 17th of 2007 when the GBP net position hit a record high of +98,366 contracts.
The British Pound’s exchange rate with the US Dollar has been in an uptrend since hitting a recent low in April. The GBP has climbed strongly over the past two weeks and closed out this week at just a touch under the 1.3000 psychological resistance level. This is the highest weekly close for the GBPUSD currency pair since July of 2023 and the first close above the 200-week moving average since that time as well.
Currencies Net Speculators Leaderboard
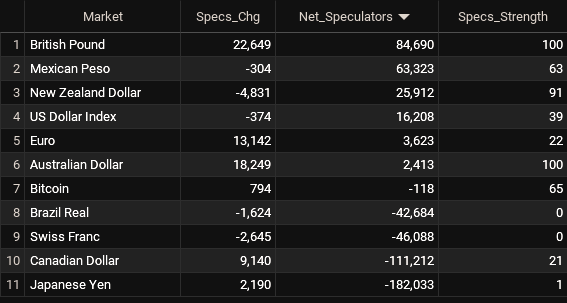
Legend: Weekly Speculators Change | Speculators Current Net Position | Speculators Strength Score compared to last 3-Years (0-100 range)
Strength Scores led by British Pound & Australian Dollar
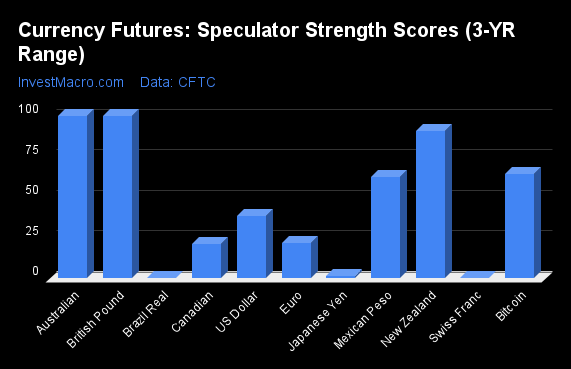
COT Strength Scores (a normalized measure of Speculator positions over a 3-Year range, from 0 to 100 where above 80 is Extreme-Bullish and below 20 is Extreme-Bearish) showed that the British Pound (100 percent) and the Australian Dollar (100 percent) lead the currency markets this week. The New Zealand Dollar (91 percent), Bitcoin (65 percent) and the Mexican Peso (63 percent) come in as the next highest in the weekly strength scores.
On the downside, the Brazilian Real (0 percent), the Swiss Franc (0 percent) and the Japanese Yen (1 percent) come in at the lowest strength levels currently and are in Extreme-Bearish territory (below 20 percent).
Strength Statistics:
US Dollar Index (38.6 percent) vs US Dollar Index previous week (39.4 percent)
EuroFX (21.9 percent) vs EuroFX previous week (16.3 percent)
British Pound Sterling (100.0 percent) vs British Pound Sterling previous week (86.3 percent)
Japanese Yen (1.3 percent) vs Japanese Yen previous week (0.0 percent)
Swiss Franc (0.0 percent) vs Swiss Franc previous week (4.7 percent)
Canadian Dollar (21.0 percent) vs Canadian Dollar previous week (15.8 percent)
Australian Dollar (100.0 percent) vs Australian Dollar previous week (83.4 percent)
New Zealand Dollar (90.7 percent) vs New Zealand Dollar previous week (100.0 percent)
Mexican Peso (62.5 percent) vs Mexican Peso previous week (62.7 percent)
Brazilian Real (0.0 percent) vs Brazilian Real previous week (1.7 percent)
Bitcoin (64.6 percent) vs Bitcoin previous week (52.7 percent)
Australian Dollar & New Zealand Dollar top the 6-Week Strength Trends
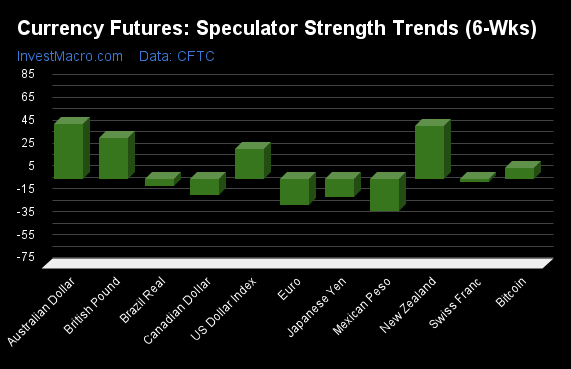
COT Strength Score Trends (or move index, calculates the 6-week changes in strength scores) showed that the Australian Dollar (48 percent) and the New Zealand Dollar (46 percent) lead the past six weeks trends for the currencies. The British Pound (36 percent), the US Dollar Index (26 percent) and Bitcoin (10 percent) are the next highest positive movers in the latest trends data.
The Mexican Peso (-28 percent) leads the downside trend scores currently with the EuroFX (-23 percent), Japanese Yen (-16 percent) and the Canadian Dollar (-14 percent) following next with lower trend scores.
Strength Trend Statistics:
US Dollar Index (25.7 percent) vs US Dollar Index previous week (27.9 percent)
EuroFX (-23.0 percent) vs EuroFX previous week (-21.7 percent)
British Pound Sterling (35.9 percent) vs British Pound Sterling previous week (36.9 percent)
Japanese Yen (-15.8 percent) vs Japanese Yen previous week (-24.3 percent)
Swiss Franc (-3.1 percent) vs Swiss Franc previous week (-5.0 percent)
Canadian Dollar (-14.1 percent) vs Canadian Dollar previous week (-16.9 percent)
Australian Dollar (47.6 percent) vs Australian Dollar previous week (36.7 percent)
New Zealand Dollar (45.9 percent) vs New Zealand Dollar previous week (61.7 percent)
Mexican Peso (-28.3 percent) vs Mexican Peso previous week (-26.6 percent)
Brazilian Real (-6.5 percent) vs Brazilian Real previous week (-3.7 percent)
Bitcoin (9.6 percent) vs Bitcoin previous week (-0.3 percent)
Individual COT Forex Markets:
US Dollar Index Futures:
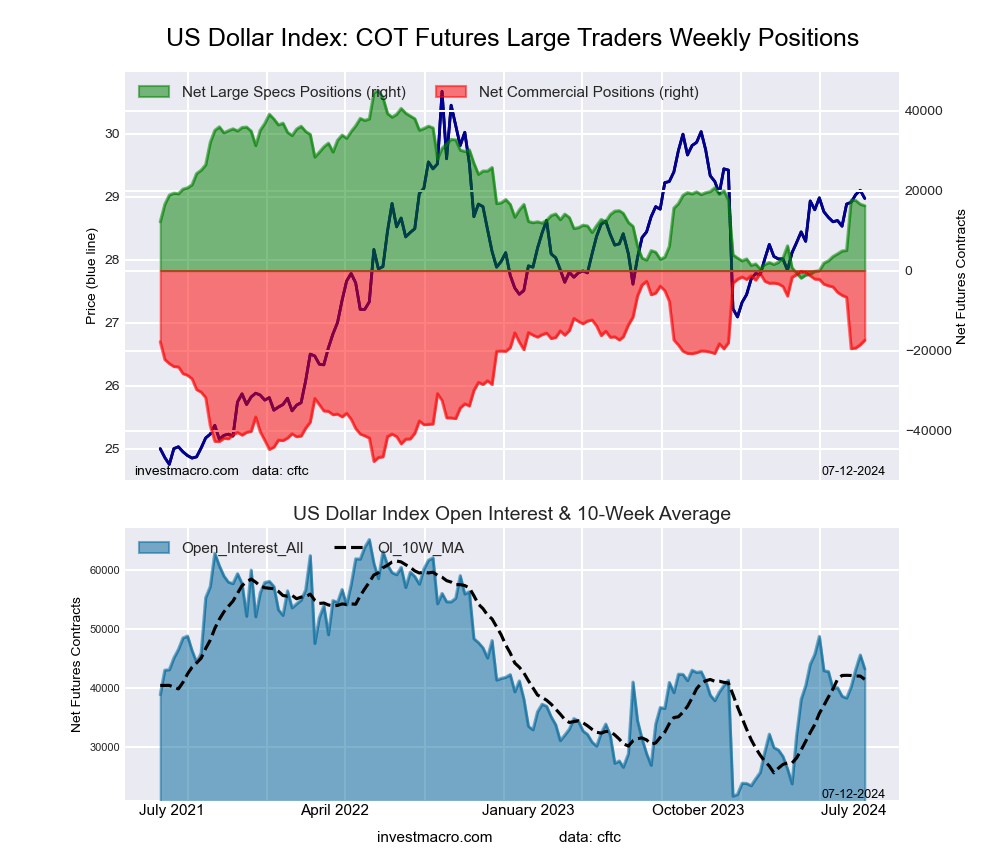
The US Dollar Index large speculator standing this week reached a net position of 16,208 contracts in the data reported through Tuesday. This was a weekly decline of -374 contracts from the previous week which had a total of 16,582 net contracts.
This week’s current strength score (the trader positioning range over the past three years, measured from 0 to 100) shows the speculators are currently Bearish with a score of 38.6 percent. The commercials are Bullish with a score of 63.9 percent and the small traders (not shown in chart) are Bearish with a score of 25.3 percent.
Price Trend-Following Model: Uptrend
Our weekly trend-following model classifies the current market price position as: Uptrend. The current action for the model is considered to be: Hold – Maintain Long Position.
| US DOLLAR INDEX Statistics | SPECULATORS | COMMERCIALS | SMALL TRADERS |
| – Percent of Open Interest Longs: | 70.7 | 18.0 | 7.4 |
| – Percent of Open Interest Shorts: | 33.2 | 58.2 | 4.6 |
| – Net Position: | 16,208 | -17,419 | 1,211 |
| – Gross Longs: | 30,587 | 7,769 | 3,200 |
| – Gross Shorts: | 14,379 | 25,188 | 1,989 |
| – Long to Short Ratio: | 2.1 to 1 | 0.3 to 1 | 1.6 to 1 |
| NET POSITION TREND: | |||
| – Strength Index Score (3 Year Range Pct): | 38.6 | 63.9 | 25.3 |
| – Strength Index Reading (3 Year Range): | Bearish | Bullish | Bearish |
| NET POSITION MOVEMENT INDEX: | |||
| – 6-Week Change in Strength Index: | 25.7 | -25.3 | -0.6 |
Euro Currency Futures:
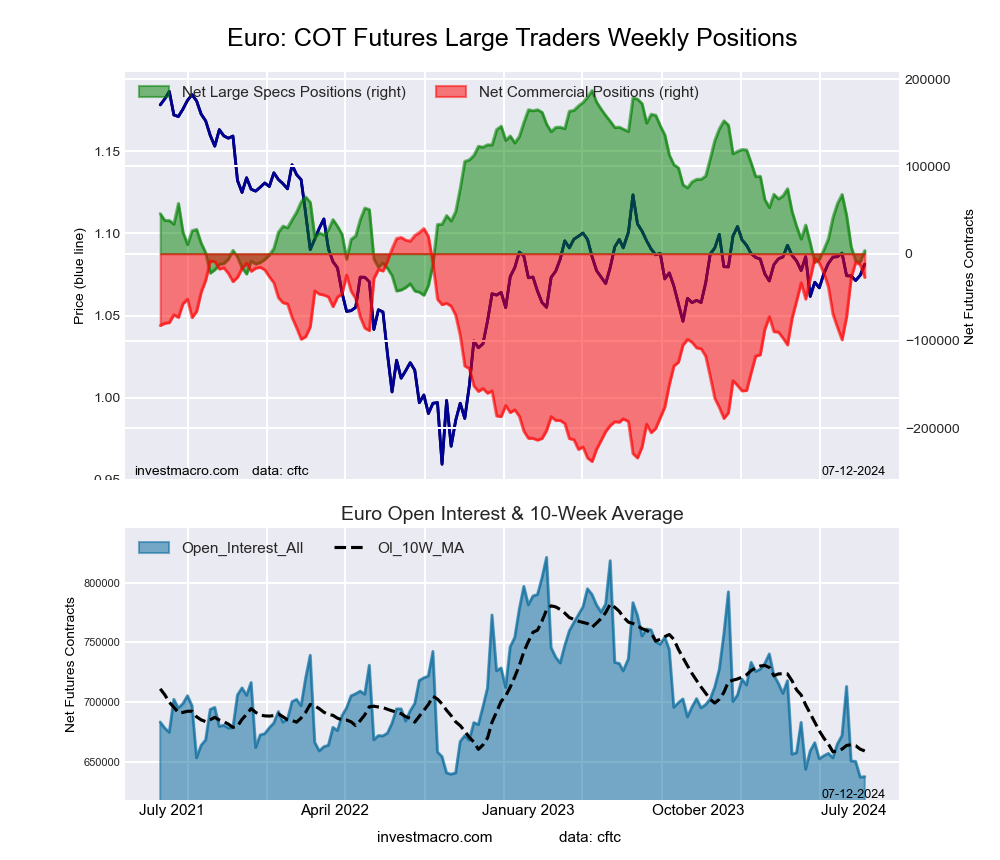
The Euro Currency large speculator standing this week reached a net position of 3,623 contracts in the data reported through Tuesday. This was a weekly lift of 13,142 contracts from the previous week which had a total of -9,519 net contracts.
This week’s current strength score (the trader positioning range over the past three years, measured from 0 to 100) shows the speculators are currently Bearish with a score of 21.9 percent. The commercials are Bullish with a score of 79.0 percent and the small traders (not shown in chart) are Bearish with a score of 23.8 percent.
Price Trend-Following Model: Weak Downtrend
Our weekly trend-following model classifies the current market price position as: Weak Downtrend. The current action for the model is considered to be: Hold – Maintain Short Position.
| EURO Currency Statistics | SPECULATORS | COMMERCIALS | SMALL TRADERS |
| – Percent of Open Interest Longs: | 26.0 | 58.9 | 11.8 |
| – Percent of Open Interest Shorts: | 25.5 | 63.2 | 8.1 |
| – Net Position: | 3,623 | -27,239 | 23,616 |
| – Gross Longs: | 165,829 | 375,248 | 75,272 |
| – Gross Shorts: | 162,206 | 402,487 | 51,656 |
| – Long to Short Ratio: | 1.0 to 1 | 0.9 to 1 | 1.5 to 1 |
| NET POSITION TREND: | |||
| – Strength Index Score (3 Year Range Pct): | 21.9 | 79.0 | 23.8 |
| – Strength Index Reading (3 Year Range): | Bearish | Bullish | Bearish |
| NET POSITION MOVEMENT INDEX: | |||
| – 6-Week Change in Strength Index: | -23.0 | 21.5 | -7.9 |
British Pound Sterling Futures:
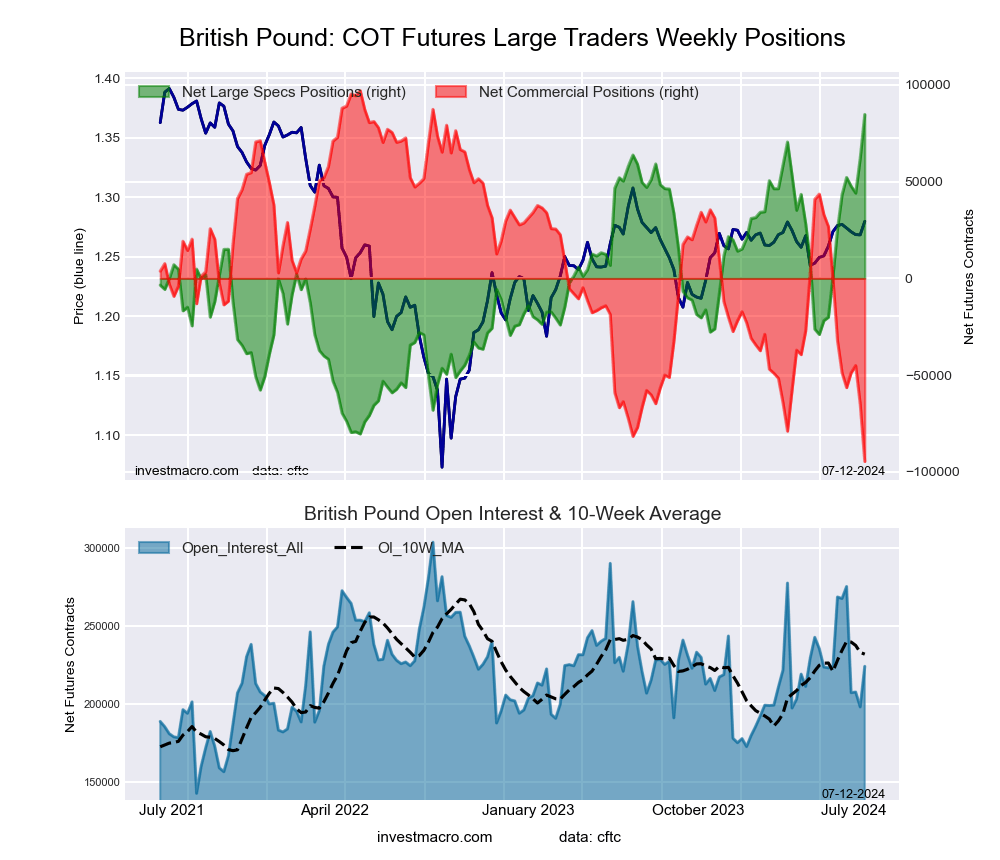
The British Pound Sterling large speculator standing this week reached a net position of 84,690 contracts in the data reported through Tuesday. This was a weekly gain of 22,649 contracts from the previous week which had a total of 62,041 net contracts.
This week’s current strength score (the trader positioning range over the past three years, measured from 0 to 100) shows the speculators are currently Bullish-Extreme with a score of 100.0 percent. The commercials are Bearish-Extreme with a score of 0.0 percent and the small traders (not shown in chart) are Bullish-Extreme with a score of 83.0 percent.
Price Trend-Following Model: Strong Uptrend
Our weekly trend-following model classifies the current market price position as: Strong Uptrend. The current action for the model is considered to be: Hold – Maintain Long Position.
| BRITISH POUND Statistics | SPECULATORS | COMMERCIALS | SMALL TRADERS |
| – Percent of Open Interest Longs: | 60.4 | 20.6 | 15.5 |
| – Percent of Open Interest Shorts: | 22.6 | 62.8 | 11.1 |
| – Net Position: | 84,690 | -94,586 | 9,896 |
| – Gross Longs: | 135,316 | 46,249 | 34,670 |
| – Gross Shorts: | 50,626 | 140,835 | 24,774 |
| – Long to Short Ratio: | 2.7 to 1 | 0.3 to 1 | 1.4 to 1 |
| NET POSITION TREND: | |||
| – Strength Index Score (3 Year Range Pct): | 100.0 | 0.0 | 83.0 |
| – Strength Index Reading (3 Year Range): | Bullish-Extreme | Bearish-Extreme | Bullish-Extreme |
| NET POSITION MOVEMENT INDEX: | |||
| – 6-Week Change in Strength Index: | 35.9 | -32.6 | 6.6 |
Japanese Yen Futures:
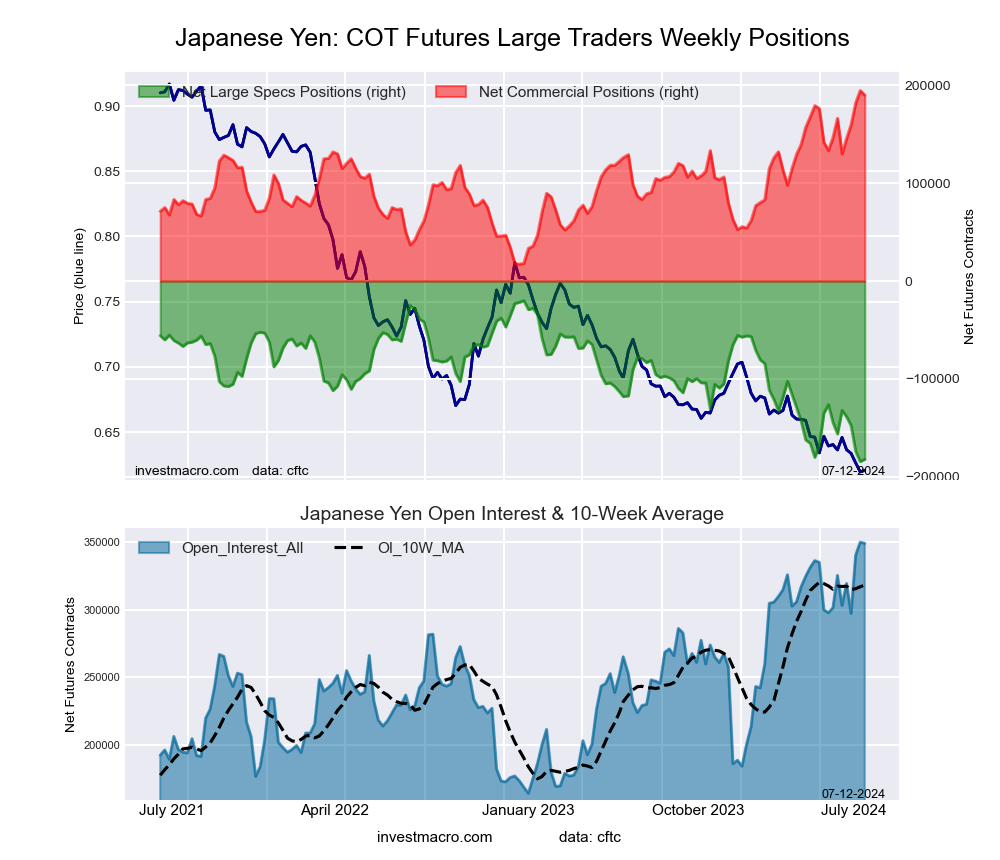 The Japanese Yen large speculator standing this week reached a net position of -182,033 contracts in the data reported through Tuesday. This was a weekly rise of 2,190 contracts from the previous week which had a total of -184,223 net contracts.
This week’s current strength score (the trader positioning range over the past three years, measured from 0 to 100) shows the speculators are currently Bearish-Extreme with a score of 1.3 percent. The commercials are Bullish-Extreme with a score of 97.4 percent and the small traders (not shown in chart) are Bullish with a score of 58.0 percent.
Price Trend-Following Model: Downtrend
Our weekly trend-following model classifies the current market price position as: Downtrend. The current action for the model is considered to be: Hold – Maintain Short Position.
| JAPANESE YEN Statistics | SPECULATORS | COMMERCIALS | SMALL TRADERS |
| – Percent of Open Interest Longs: | 11.9 | 73.8 | 11.9 |
| – Percent of Open Interest Shorts: | 64.1 | 19.4 | 14.1 |
| – Net Position: | -182,033 | 189,867 | -7,834 |
| – Gross Longs: | 41,521 | 257,455 | 41,519 |
| – Gross Shorts: | 223,554 | 67,588 | 49,353 |
| – Long to Short Ratio: | 0.2 to 1 | 3.8 to 1 | 0.8 to 1 |
| NET POSITION TREND: | |||
| – Strength Index Score (3 Year Range Pct): | 1.3 | 97.4 | 58.0 |
| – Strength Index Reading (3 Year Range): | Bearish-Extreme | Bullish-Extreme | Bullish |
| NET POSITION MOVEMENT INDEX: | |||
| – 6-Week Change in Strength Index: | -15.8 | 13.4 | 7.1 |
Swiss Franc Futures:
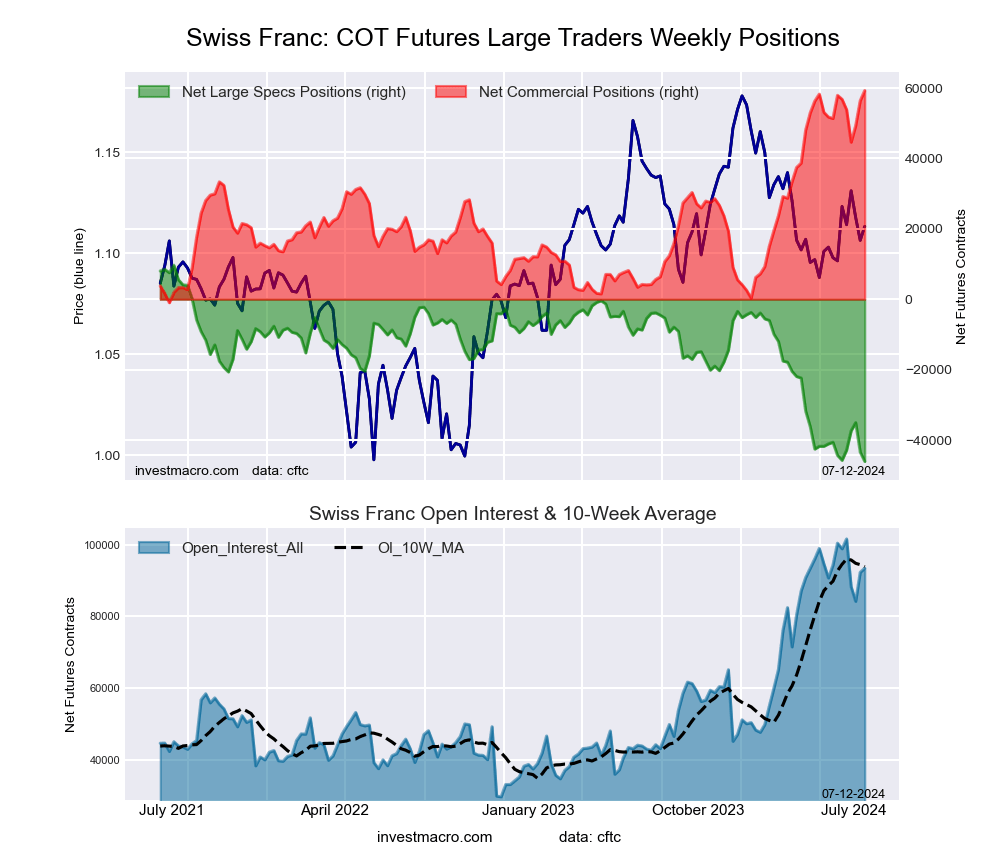
The Swiss Franc large speculator standing this week reached a net position of -46,088 contracts in the data reported through Tuesday. This was a weekly fall of -2,645 contracts from the previous week which had a total of -43,443 net contracts.
This week’s current strength score (the trader positioning range over the past three years, measured from 0 to 100) shows the speculators are currently Bearish-Extreme with a score of 0.0 percent. The commercials are Bullish-Extreme with a score of 100.0 percent and the small traders (not shown in chart) are Bearish-Extreme with a score of 17.2 percent.
Price Trend-Following Model: Weak Downtrend
Our weekly trend-following model classifies the current market price position as: Weak Downtrend. The current action for the model is considered to be: Hold – Maintain Short Position.
| SWISS FRANC Statistics | SPECULATORS | COMMERCIALS | SMALL TRADERS |
| – Percent of Open Interest Longs: | 5.7 | 83.3 | 10.4 |
| – Percent of Open Interest Shorts: | 55.0 | 19.9 | 24.6 |
| – Net Position: | -46,088 | 59,298 | -13,210 |
| – Gross Longs: | 5,338 | 77,860 | 9,743 |
| – Gross Shorts: | 51,426 | 18,562 | 22,953 |
| – Long to Short Ratio: | 0.1 to 1 | 4.2 to 1 | 0.4 to 1 |
| NET POSITION TREND: | |||
| – Strength Index Score (3 Year Range Pct): | 0.0 | 100.0 | 17.2 |
| – Strength Index Reading (3 Year Range): | Bearish-Extreme | Bullish-Extreme | Bearish-Extreme |
| NET POSITION MOVEMENT INDEX: | |||
| – 6-Week Change in Strength Index: | -3.1 | 2.3 | 1.6 |
Canadian Dollar Futures:
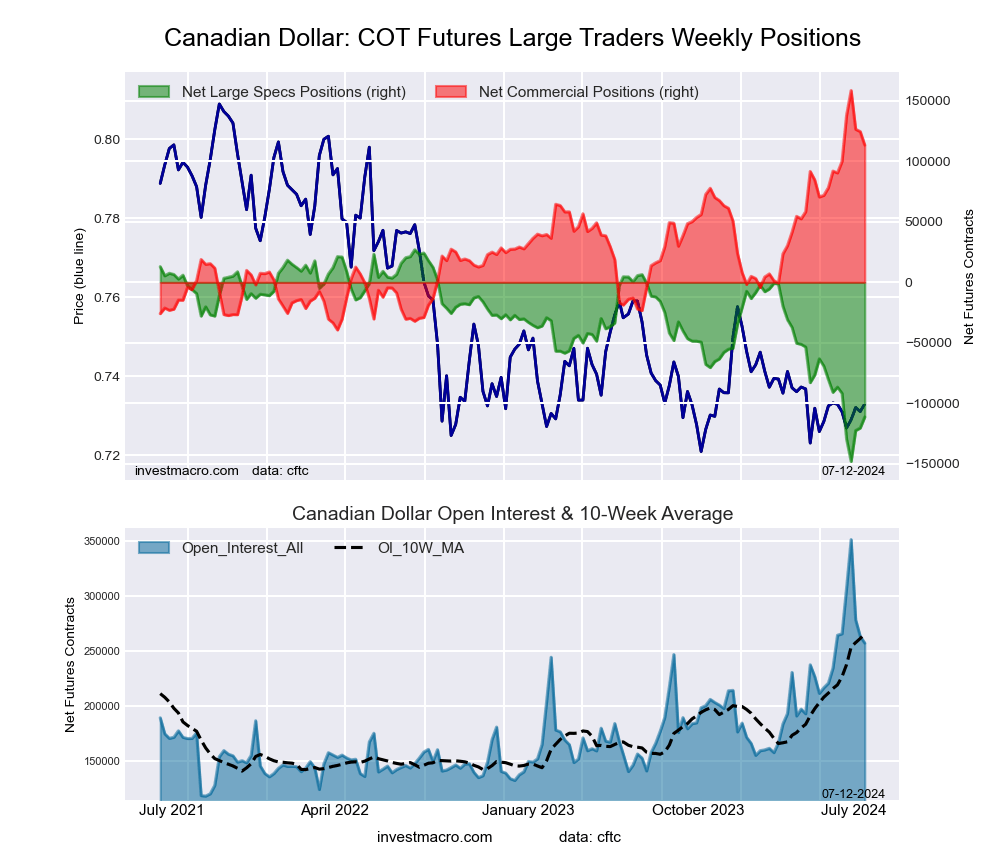
The Canadian Dollar large speculator standing this week reached a net position of -111,212 contracts in the data reported through Tuesday. This was a weekly advance of 9,140 contracts from the previous week which had a total of -120,352 net contracts.
This week’s current strength score (the trader positioning range over the past three years, measured from 0 to 100) shows the speculators are currently Bearish with a score of 21.0 percent. The commercials are Bullish with a score of 77.2 percent and the small traders (not shown in chart) are Bearish with a score of 24.6 percent.
Price Trend-Following Model: Weak Downtrend
Our weekly trend-following model classifies the current market price position as: Weak Downtrend. The current action for the model is considered to be: Hold – Maintain Short Position.
| CANADIAN DOLLAR Statistics | SPECULATORS | COMMERCIALS | SMALL TRADERS |
| – Percent of Open Interest Longs: | 7.9 | 77.0 | 12.3 |
| – Percent of Open Interest Shorts: | 51.1 | 33.0 | 13.1 |
| – Net Position: | -111,212 | 113,308 | -2,096 |
| – Gross Longs: | 20,263 | 198,168 | 31,676 |
| – Gross Shorts: | 131,475 | 84,860 | 33,772 |
| – Long to Short Ratio: | 0.2 to 1 | 2.3 to 1 | 0.9 to 1 |
| NET POSITION TREND: | |||
| – Strength Index Score (3 Year Range Pct): | 21.0 | 77.2 | 24.6 |
| – Strength Index Reading (3 Year Range): | Bearish | Bullish | Bearish |
| NET POSITION MOVEMENT INDEX: | |||
| – 6-Week Change in Strength Index: | -14.1 | 11.6 | 4.9 |
Australian Dollar Futures:
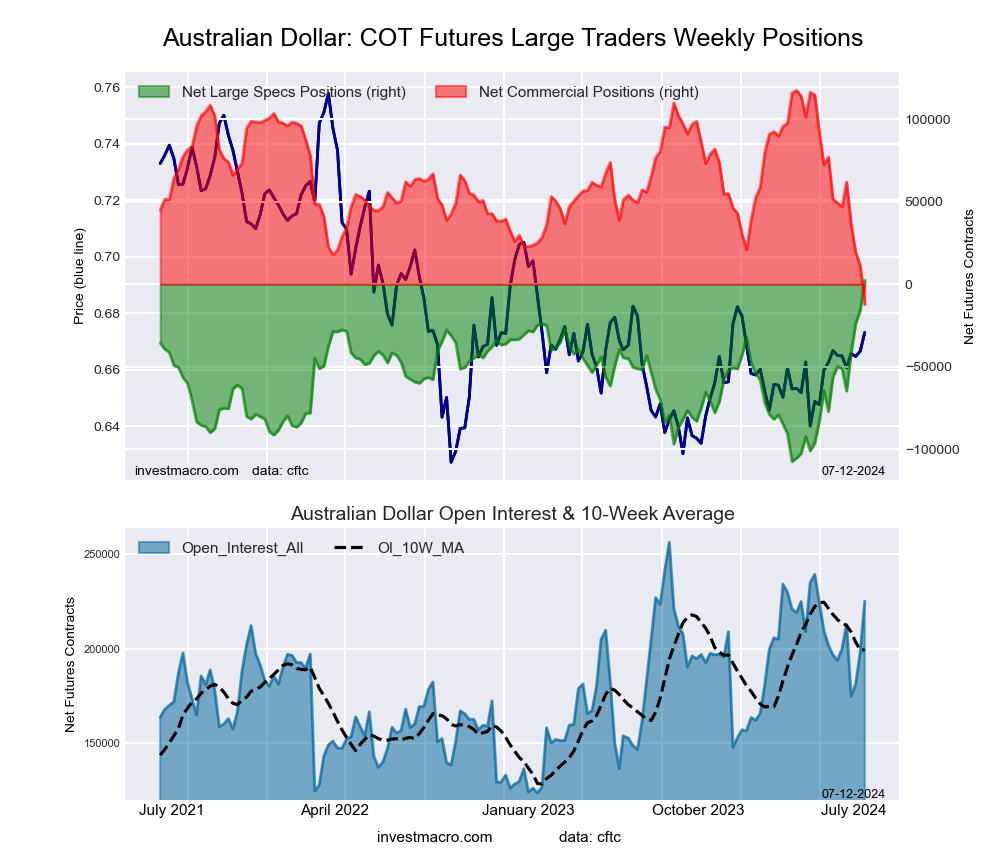
The Australian Dollar large speculator standing this week reached a net position of 2,413 contracts in the data reported through Tuesday. This was a weekly advance of 18,249 contracts from the previous week which had a total of -15,836 net contracts.
This week’s current strength score (the trader positioning range over the past three years, measured from 0 to 100) shows the speculators are currently Bullish-Extreme with a score of 100.0 percent. The commercials are Bearish-Extreme with a score of 0.0 percent and the small traders (not shown in chart) are Bullish-Extreme with a score of 85.1 percent.
Price Trend-Following Model: Strong Uptrend
Our weekly trend-following model classifies the current market price position as: Strong Uptrend. The current action for the model is considered to be: Hold – Maintain Long Position.
| AUSTRALIAN DOLLAR Statistics | SPECULATORS | COMMERCIALS | SMALL TRADERS |
| – Percent of Open Interest Longs: | 44.0 | 39.6 | 13.5 |
| – Percent of Open Interest Shorts: | 42.9 | 45.0 | 9.1 |
| – Net Position: | 2,413 | -12,132 | 9,719 |
| – Gross Longs: | 98,997 | 89,192 | 30,274 |
| – Gross Shorts: | 96,584 | 101,324 | 20,555 |
| – Long to Short Ratio: | 1.0 to 1 | 0.9 to 1 | 1.5 to 1 |
| NET POSITION TREND: | |||
| – Strength Index Score (3 Year Range Pct): | 100.0 | 0.0 | 85.1 |
| – Strength Index Reading (3 Year Range): | Bullish-Extreme | Bearish-Extreme | Bullish-Extreme |
| NET POSITION MOVEMENT INDEX: | |||
| – 6-Week Change in Strength Index: | 47.6 | -47.4 | 25.0 |
New Zealand Dollar Futures:
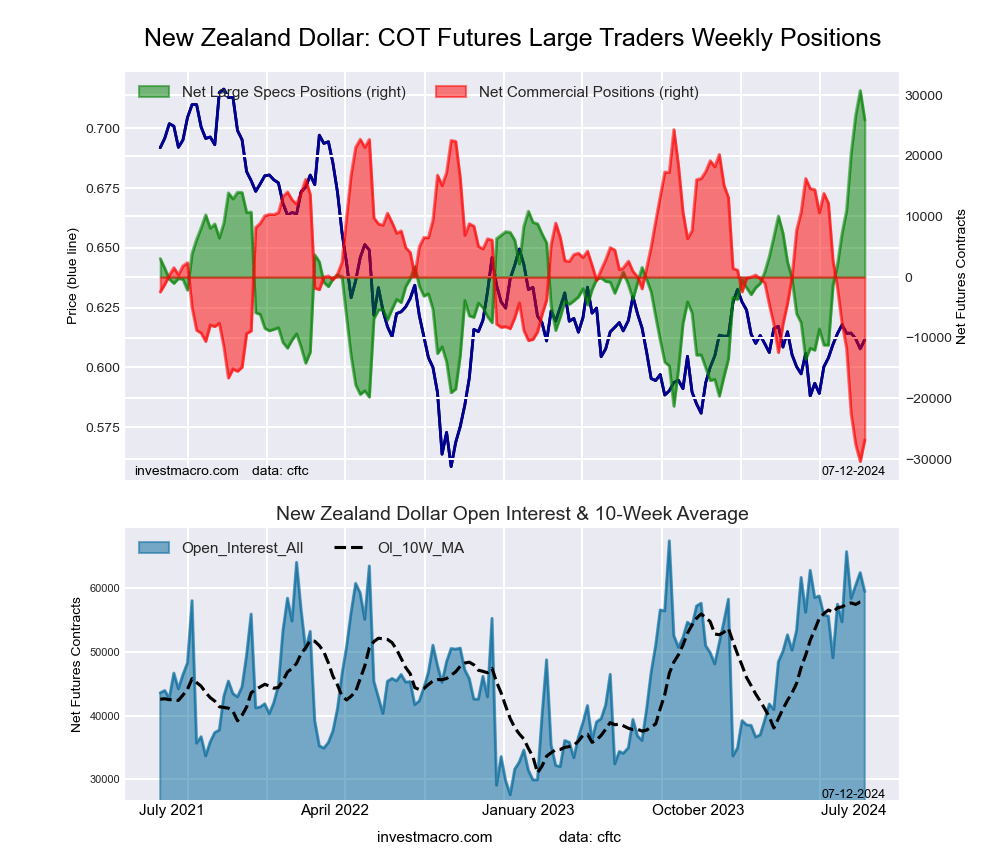
The New Zealand Dollar large speculator standing this week reached a net position of 25,912 contracts in the data reported through Tuesday. This was a weekly reduction of -4,831 contracts from the previous week which had a total of 30,743 net contracts.
This week’s current strength score (the trader positioning range over the past three years, measured from 0 to 100) shows the speculators are currently Bullish-Extreme with a score of 90.7 percent. The commercials are Bearish-Extreme with a score of 6.5 percent and the small traders (not shown in chart) are Bullish with a score of 71.2 percent.
Price Trend-Following Model: Strong Uptrend
Our weekly trend-following model classifies the current market price position as: Strong Uptrend. The current action for the model is considered to be: Hold – Maintain Long Position.
| NEW ZEALAND DOLLAR Statistics | SPECULATORS | COMMERCIALS | SMALL TRADERS |
| – Percent of Open Interest Longs: | 70.0 | 18.7 | 7.1 |
| – Percent of Open Interest Shorts: | 26.5 | 63.8 | 5.6 |
| – Net Position: | 25,912 | -26,828 | 916 |
| – Gross Longs: | 41,683 | 11,129 | 4,250 |
| – Gross Shorts: | 15,771 | 37,957 | 3,334 |
| – Long to Short Ratio: | 2.6 to 1 | 0.3 to 1 | 1.3 to 1 |
| NET POSITION TREND: | |||
| – Strength Index Score (3 Year Range Pct): | 90.7 | 6.5 | 71.2 |
| – Strength Index Reading (3 Year Range): | Bullish-Extreme | Bearish-Extreme | Bullish |
| NET POSITION MOVEMENT INDEX: | |||
| – 6-Week Change in Strength Index: | 45.9 | -45.8 | 16.5 |
Mexican Peso Futures:
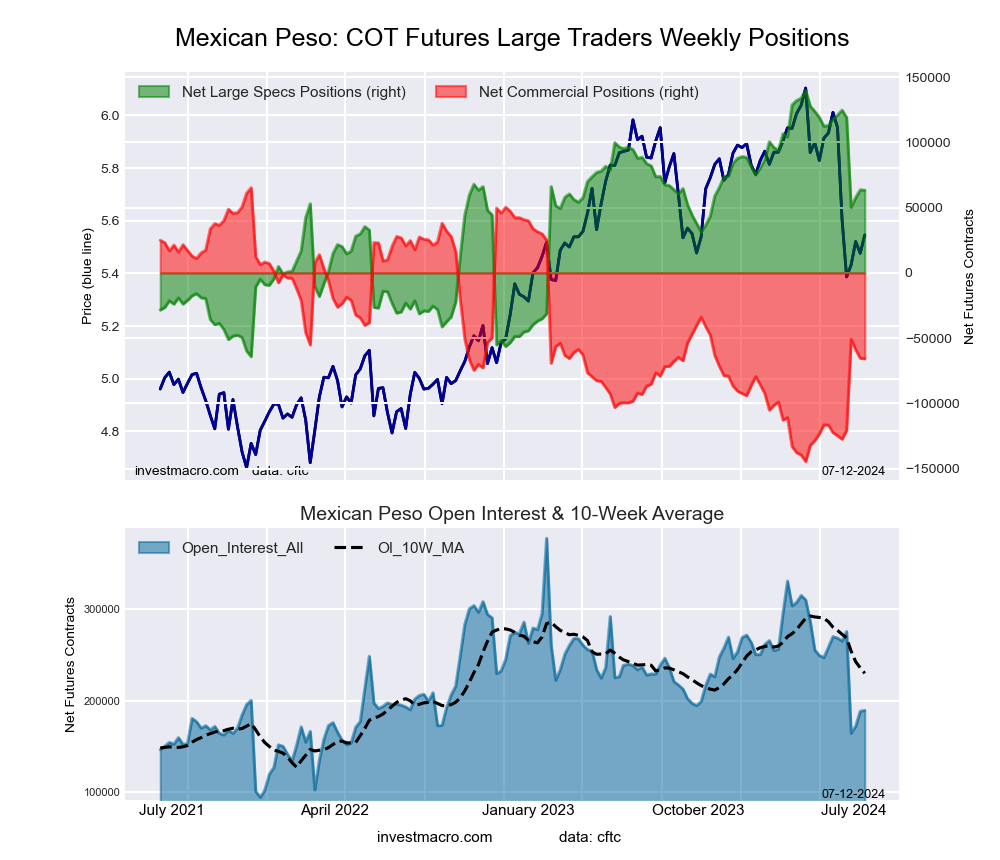
The Mexican Peso large speculator standing this week reached a net position of 63,323 contracts in the data reported through Tuesday. This was a weekly decline of -304 contracts from the previous week which had a total of 63,627 net contracts.
This week’s current strength score (the trader positioning range over the past three years, measured from 0 to 100) shows the speculators are currently Bullish with a score of 62.5 percent. The commercials are Bearish with a score of 37.5 percent and the small traders (not shown in chart) are Bearish with a score of 26.6 percent.
Price Trend-Following Model: Downtrend
Our weekly trend-following model classifies the current market price position as: Downtrend. The current action for the model is considered to be: Hold – Maintain Short Position.
| MEXICAN PESO Statistics | SPECULATORS | COMMERCIALS | SMALL TRADERS |
| – Percent of Open Interest Longs: | 50.6 | 45.1 | 3.2 |
| – Percent of Open Interest Shorts: | 17.1 | 79.9 | 2.0 |
| – Net Position: | 63,323 | -65,743 | 2,420 |
| – Gross Longs: | 95,748 | 85,441 | 6,150 |
| – Gross Shorts: | 32,425 | 151,184 | 3,730 |
| – Long to Short Ratio: | 3.0 to 1 | 0.6 to 1 | 1.6 to 1 |
| NET POSITION TREND: | |||
| – Strength Index Score (3 Year Range Pct): | 62.5 | 37.5 | 26.6 |
| – Strength Index Reading (3 Year Range): | Bullish | Bearish | Bearish |
| NET POSITION MOVEMENT INDEX: | |||
| – 6-Week Change in Strength Index: | -28.3 | 28.1 | -8.7 |
Brazilian Real Futures:
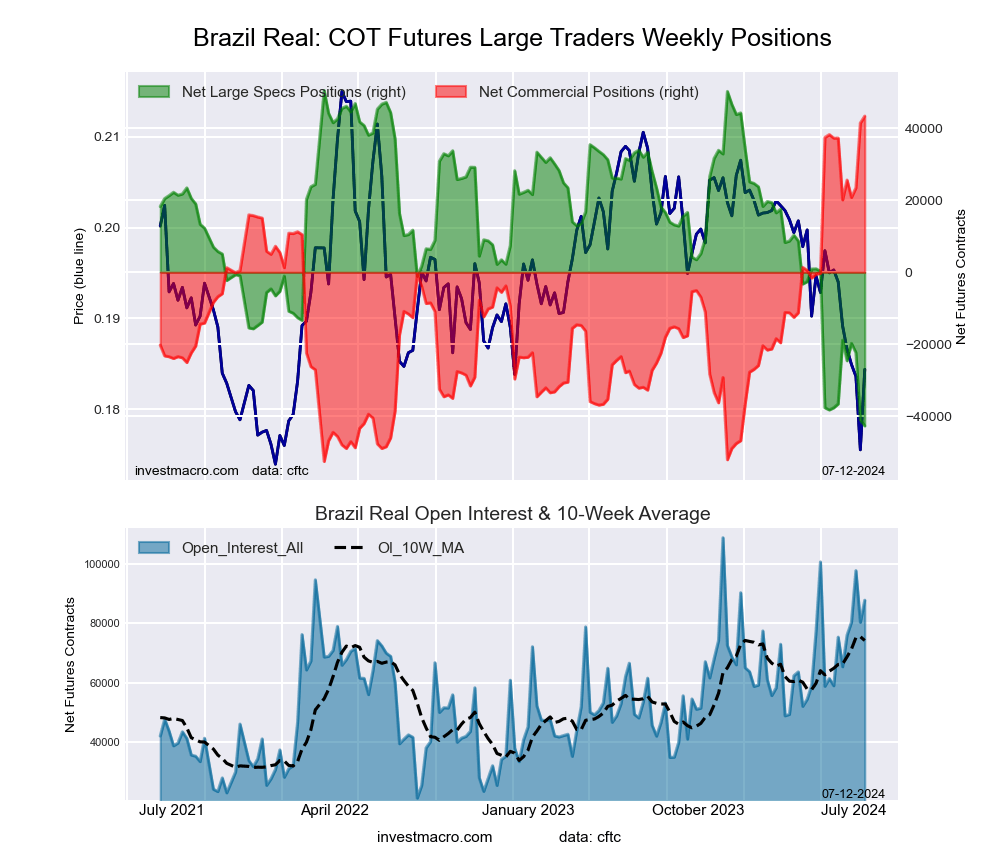
The Brazilian Real large speculator standing this week reached a net position of -42,684 contracts in the data reported through Tuesday. This was a weekly lowering of -1,624 contracts from the previous week which had a total of -41,060 net contracts.
This week’s current strength score (the trader positioning range over the past three years, measured from 0 to 100) shows the speculators are currently Bearish-Extreme with a score of 0.0 percent. The commercials are Bullish-Extreme with a score of 100.0 percent and the small traders (not shown in chart) are Bearish with a score of 27.9 percent.
Price Trend-Following Model: Downtrend
Our weekly trend-following model classifies the current market price position as: Downtrend. The current action for the model is considered to be: Hold – Maintain Short Position.
| BRAZIL REAL Statistics | SPECULATORS | COMMERCIALS | SMALL TRADERS |
| – Percent of Open Interest Longs: | 26.6 | 70.9 | 2.2 |
| – Percent of Open Interest Shorts: | 75.2 | 21.4 | 3.0 |
| – Net Position: | -42,684 | 43,388 | -704 |
| – Gross Longs: | 23,319 | 62,170 | 1,919 |
| – Gross Shorts: | 66,003 | 18,782 | 2,623 |
| – Long to Short Ratio: | 0.4 to 1 | 3.3 to 1 | 0.7 to 1 |
| NET POSITION TREND: | |||
| – Strength Index Score (3 Year Range Pct): | 0.0 | 100.0 | 27.9 |
| – Strength Index Reading (3 Year Range): | Bearish-Extreme | Bullish-Extreme | Bearish |
| NET POSITION MOVEMENT INDEX: | |||
| – 6-Week Change in Strength Index: | -6.5 | 6.3 | 0.1 |
Bitcoin Futures:
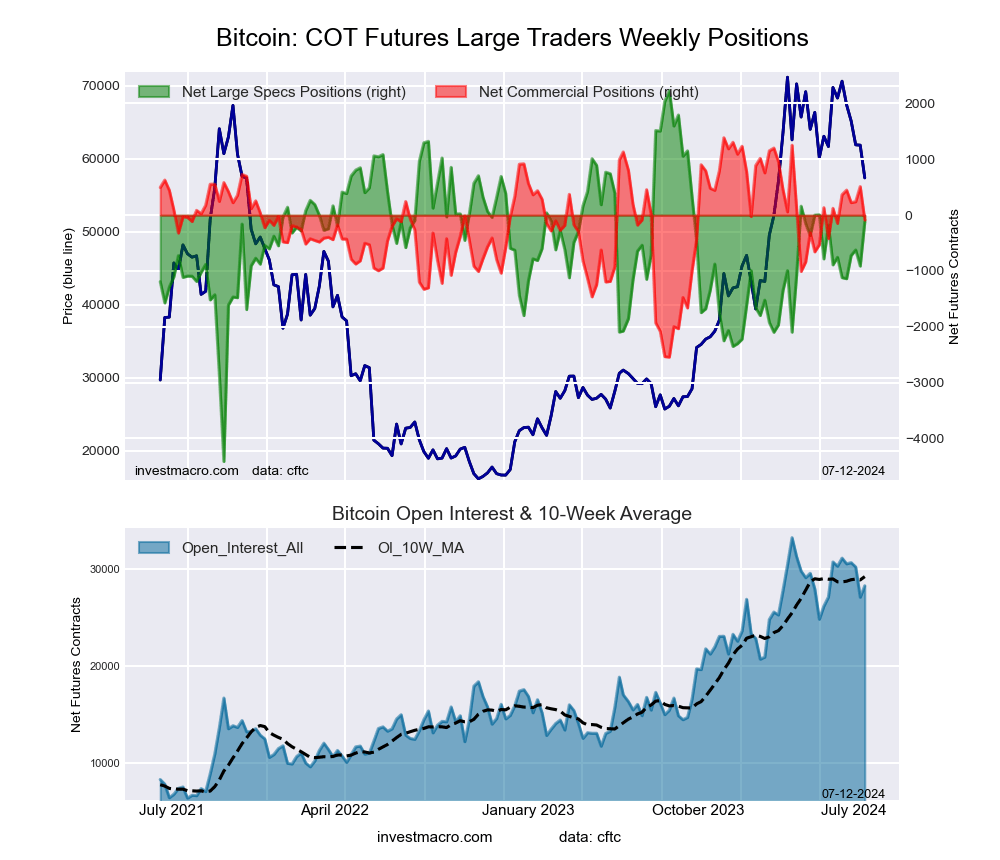 The Bitcoin large speculator standing this week reached a net position of -118 contracts in the data reported through Tuesday. This was a weekly increase of 794 contracts from the previous week which had a total of -912 net contracts.
This week’s current strength score (the trader positioning range over the past three years, measured from 0 to 100) shows the speculators are currently Bullish with a score of 64.6 percent. The commercials are Bullish with a score of 62.5 percent and the small traders (not shown in chart) are Bearish-Extreme with a score of 17.6 percent.
Price Trend-Following Model: Strong Downtrend
Our weekly trend-following model classifies the current market price position as: Strong Downtrend. The current action for the model is considered to be: New Sell – Short Position.
| BITCOIN Statistics | SPECULATORS | COMMERCIALS | SMALL TRADERS |
| – Percent of Open Interest Longs: | 81.7 | 2.6 | 4.8 |
| – Percent of Open Interest Shorts: | 82.2 | 2.9 | 4.1 |
| – Net Position: | -118 | -88 | 206 |
| – Gross Longs: | 23,083 | 736 | 1,363 |
| – Gross Shorts: | 23,201 | 824 | 1,157 |
| – Long to Short Ratio: | 1.0 to 1 | 0.9 to 1 | 1.2 to 1 |
| NET POSITION TREND: | |||
| – Strength Index Score (3 Year Range Pct): | 64.6 | 62.5 | 17.6 |
| – Strength Index Reading (3 Year Range): | Bullish | Bullish | Bearish-Extreme |
| NET POSITION MOVEMENT INDEX: | |||
| – 6-Week Change in Strength Index: | 9.6 | 1.5 | -15.9 |
Article By InvestMacro – Receive our weekly COT Newsletter
*COT Report: The COT data, released weekly to the public each Friday, is updated through the most recent Tuesday (data is 3 days old) and shows a quick view of how large speculators or non-commercials (for-profit traders) were positioned in the futures markets.
The CFTC categorizes trader positions according to commercial hedgers (traders who use futures contracts for hedging as part of the business), non-commercials (large traders who speculate to realize trading profits) and nonreportable traders (usually small traders/speculators) as well as their open interest (contracts open in the market at time of reporting). See CFTC criteria here.
More By This Author:
Speculator Extremes: Australian Dollar, Soybean Oil Lead Weekly Positions
Currency Speculators Raised Their Bets For Canadian & Australian Dollars
Currency Speculators Drop Swiss Franc Bets To Lowest Since 2018
Disclosure: Foreign Currency trading and trading on margin carries a high level of risk and can result in loss of part or all of your investment.Due to the level of risk and market volatility, ...
more

