
Here are the latest charts and statistics for the Commitment of Traders (COT) data published by the Commodities Futures Trading Commission (CFTC).
The latest COT data is updated through Tuesday July 26th and shows a quick view of how large traders (for-profit speculators and commercial entities) were positioned in the futures markets.
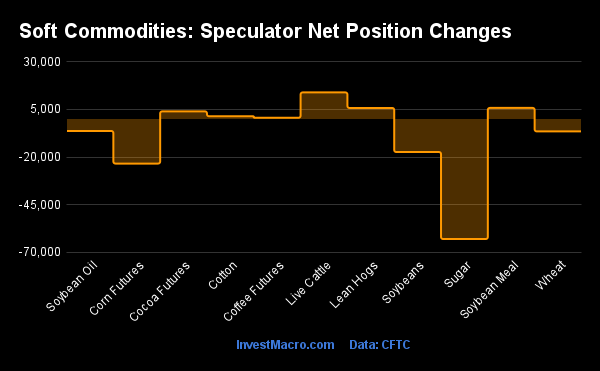
Weekly Speculator Changes
COT soft commodities speculator bets were overall slightly higher this week as six out of the eleven soft commodities markets we cover had higher positioning this week while the other five markets had lower contracts.
Leading the gains for soft commodities markets was Live Cattle (13,971 contracts) and Soybean Meal (5,833 contracts) with Lean Hogs (5,802 contracts), Cocoa (4,010 contracts), Cotton (1,447 contracts) and Coffee (662 contracts) also showing a positive weeks.
The softs markets leading the declines in speculator bets this week were Sugar (-63,059 contracts) and Corn (-23,412 contracts) with Soybeans (-17,352 contracts), Wheat (-6,497 contracts) and Soybean Oil (-6,295 contracts) also seeing lower bets on the week.
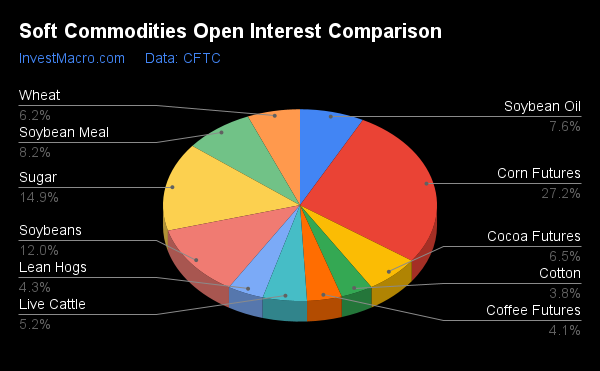
Data Snapshot of Commodity Market Traders | Columns Legend
| WTI Crude | 1,597,451 | 2 | 259,260 | 0 | -283,489 | 100 | 24,229 | 49 |
| Corn | 1,320,768 | 2 | 186,528 | 54 | -138,899 | 52 | -47,629 | 16 |
| Natural Gas | 976,126 | 4 | -118,290 | 43 | 83,028 | 57 | 35,262 | 64 |
| Sugar | 722,469 | 4 | 64,103 | 50 | -65,756 | 56 | 1,653 | 10 |
| Soybeans | 583,850 | 0 | 85,241 | 40 | -57,573 | 66 | -27,668 | 24 |
| Gold | 487,515 | 10 | 92,690 | 0 | -108,422 | 100 | 15,732 | 0 |
| Wheat | 301,674 | 6 | 25 | 19 | 8,068 | 71 | -8,093 | 68 |
| Heating Oil | 269,127 | 23 | 18,684 | 70 | -33,531 | 36 | 14,847 | 50 |
| Coffee | 199,536 | 5 | 28,641 | 64 | -28,867 | 43 | 226 | 2 |
| Copper | 183,958 | 15 | -26,562 | 23 | 26,839 | 78 | -277 | 24 |
| Brent | 177,837 | 22 | -41,482 | 42 | 40,557 | 61 | 925 | 22 |
| Silver | 147,784 | 14 | -4,500 | 0 | -2,653 | 100 | 7,153 | 4 |
| Platinum | 73,423 | 45 | -4,468 | 2 | -171 | 98 | 4,639 | 27 |
| Palladium | 7,124 | 4 | -3,408 | 4 | 3,894 | 97 | -486 | 16 |
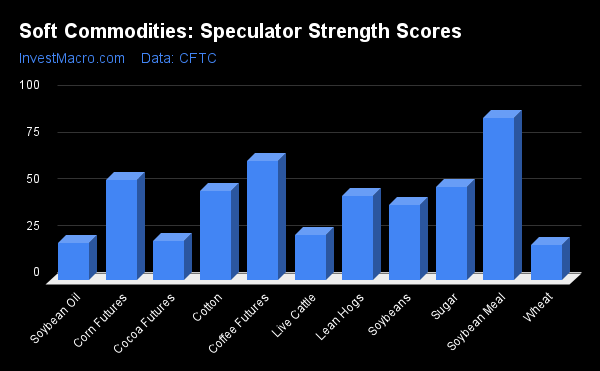
Strength Scores
Strength Scores (a normalized measure of Speculator positions over a 3-Year range, from 0 to 100 where above 80 is extreme bullish and below 20 is extreme bearish) show that Soybean Meal (86.8 percent) has seen rising speculator sentiment recently and is currently in a bullish extreme position (above 80 percent). Coffee (63.6 percent) comes in as the next highest soft commodity markets market in strength scores followed by Corn (53.9 percent) and Sugar (49.8 percent). On the downside, Wheat (19.1 percent) comes in at the lowest strength level currently, followed by Soybean Oil (19.9 percent) and both of these markets have bearish extreme readings.
Strength Statistics:
Corn (53.9 percent) vs Corn previous week (56.8 percent)
Sugar (49.8 percent) vs Sugar previous week (62.8 percent)
Coffee (63.6 percent) vs Coffee previous week (63.0 percent)
Soybeans (40.1 percent) vs Soybeans previous week (45.4 percent)
Soybean Oil (19.9 percent) vs Soybean Oil previous week (24.1 percent)
Soybean Meal (86.8 percent) vs Soybean Meal previous week (83.5 percent)
Live Cattle (24.4 percent) vs Live Cattle previous week (6.9 percent)
Lean Hogs (45.3 percent) vs Lean Hogs previous week (39.0 percent)
Cotton (47.6 percent) vs Cotton previous week (46.7 percent)
Cocoa (21.0 percent) vs Cocoa previous week (17.0 percent)
Wheat (19.1 percent) vs Wheat previous week (27.5 percent)
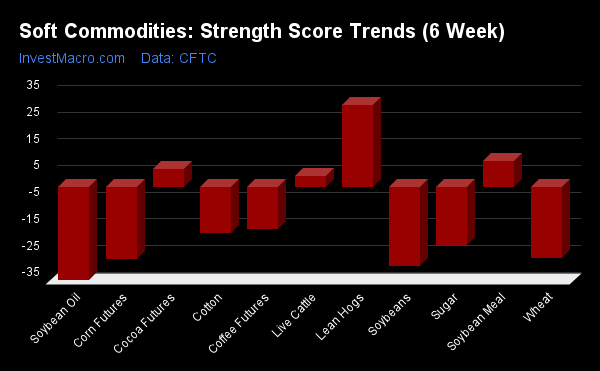
Strength Trends
Strength Score Trends (or move index, calculates the 6-week changes in strength scores) show that the Lean Hogs (30.5 percent) leads the past six weeks trends for soft commodity markets this week. Soybean Meal (9.8 percent), Cocoa (6.6 percent) and Live Cattle (4.0 percent) fill out the only other positive movers in the latest trends data. Soybean Oil (-34.9 percent) leads the downside trend scores currently while the next markets with lower trend scores were Soybeans (-29.6 percent), Corn (-27.2 percent), Wheat (-26.6 percent) and Sugar (-21.9 percent).
Strength Trend Statistics:
Corn (-27.2 percent) vs Corn previous week (-23.2 percent)
Sugar (-21.9 percent) vs Sugar previous week (-14.0 percent)
Coffee (-15.8 percent) vs Coffee previous week (-18.0 percent)
Soybeans (-29.6 percent) vs Soybeans previous week (-22.5 percent)
Soybean Oil (-34.9 percent) vs Soybean Oil previous week (-34.2 percent)
Soybean Meal (9.8 percent) vs Soybean Meal previous week (6.1 percent)
Live Cattle (4.0 percent) vs Live Cattle previous week (-4.4 percent)
Lean Hogs (30.5 percent) vs Lean Hogs previous week (20.8 percent)
Cotton (-17.3 percent) vs Cotton previous week (-21.0 percent)
Cocoa (6.6 percent) vs Cocoa previous week (-14.8 percent)
Wheat (-26.6 percent) vs Wheat previous week (-22.6 percent)
Individual Markets:
CORN Futures:
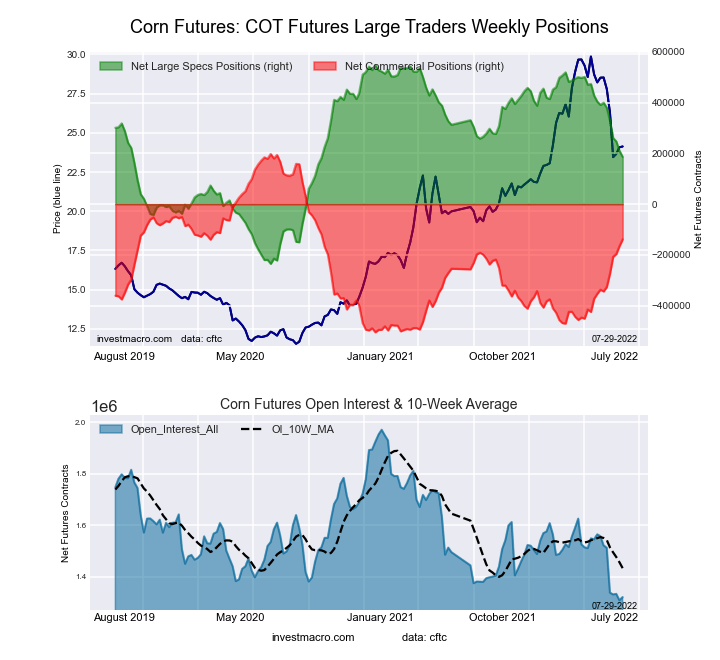
The CORN large speculator standing this week recorded a net position of 186,528 contracts in the data reported through Tuesday. This was a weekly decline of -23,412 contracts from the previous week which had a total of 209,940 net contracts.
This week’s current strength score (the trader positioning range over the past three years, measured from 0 to 100) shows the speculators are currently Bullish with a score of 53.9 percent. The commercials are Bullish with a score of 52.1 percent and the small traders (not shown in chart) are Bearish-Extreme with a score of 15.6 percent.
| CORN Futures Statistics | SPECULATORS | COMMERCIALS | SMALL TRADERS |
| – Percent of Open Interest Longs: | 25.0 | 49.2 | 9.7 |
| – Percent of Open Interest Shorts: | 10.9 | 59.7 | 13.3 |
| – Net Position: | 186,528 | -138,899 | -47,629 |
| – Gross Longs: | 330,027 | 649,795 | 128,521 |
| – Gross Shorts: | 143,499 | 788,694 | 176,150 |
| – Long to Short Ratio: | 2.3 to 1 | 0.8 to 1 | 0.7 to 1 |
| NET POSITION TREND: | |||
| – Strength Index Score (3 Year Range Pct): | 53.9 | 52.1 | 15.6 |
| – Strength Index Reading (3 Year Range): | Bullish | Bullish | Bearish-Extreme |
| NET POSITION MOVEMENT INDEX: | |||
| – 6-Week Change in Strength Index: | -27.2 | 29.2 | 4.6 |
SUGAR Futures:
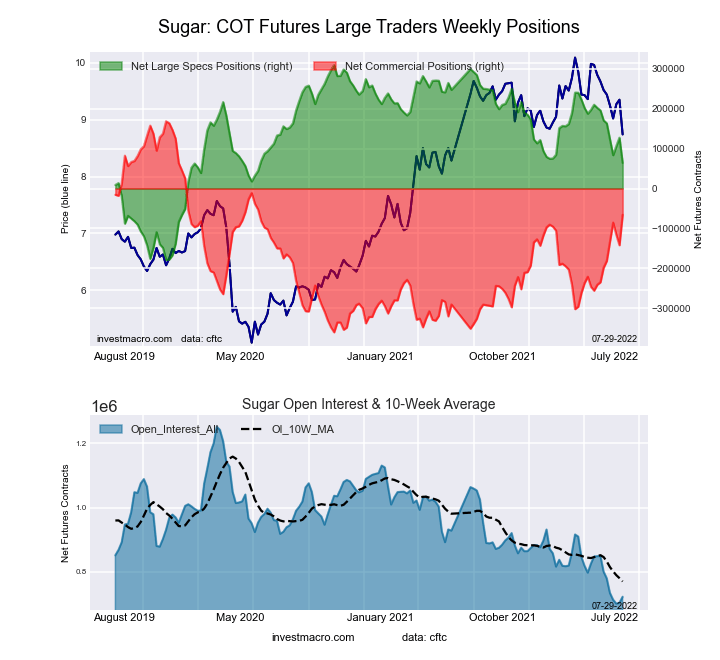
The SUGAR large speculator standing this week recorded a net position of 64,103 contracts in the data reported through Tuesday. This was a weekly lowering of -63,059 contracts from the previous week which had a total of 127,162 net contracts.
This week’s current strength score (the trader positioning range over the past three years, measured from 0 to 100) shows the speculators are currently Bearish with a score of 49.8 percent. The commercials are Bullish with a score of 55.7 percent and the small traders (not shown in chart) are Bearish-Extreme with a score of 9.9 percent.
| SUGAR Futures Statistics | SPECULATORS | COMMERCIALS | SMALL TRADERS |
| – Percent of Open Interest Longs: | 25.2 | 52.4 | 9.0 |
| – Percent of Open Interest Shorts: | 16.3 | 61.5 | 8.8 |
| – Net Position: | 64,103 | -65,756 | 1,653 |
| – Gross Longs: | 181,773 | 378,486 | 64,876 |
| – Gross Shorts: | 117,670 | 444,242 | 63,223 |
| – Long to Short Ratio: | 1.5 to 1 | 0.9 to 1 | 1.0 to 1 |
| NET POSITION TREND: | |||
| – Strength Index Score (3 Year Range Pct): | 49.8 | 55.7 | 9.9 |
| – Strength Index Reading (3 Year Range): | Bearish | Bullish | Bearish-Extreme |
| NET POSITION MOVEMENT INDEX: | |||
| – 6-Week Change in Strength Index: | -21.9 | 25.1 | -32.0 |
COFFEE Futures:
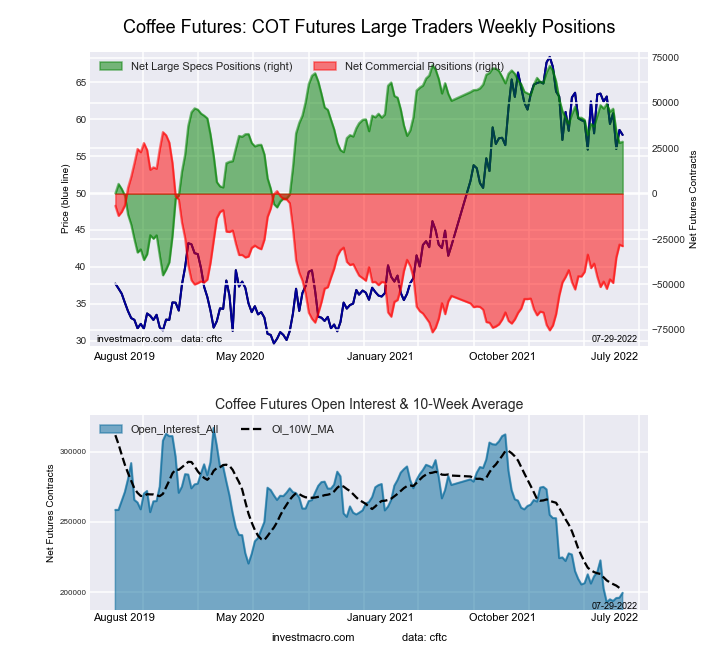
The COFFEE large speculator standing this week recorded a net position of 28,641 contracts in the data reported through Tuesday. This was a weekly advance of 662 contracts from the previous week which had a total of 27,979 net contracts.
This week’s current strength score (the trader positioning range over the past three years, measured from 0 to 100) shows the speculators are currently Bullish with a score of 63.6 percent. The commercials are Bearish with a score of 43.0 percent and the small traders (not shown in chart) are Bearish-Extreme with a score of 1.6 percent.
| COFFEE Futures Statistics | SPECULATORS | COMMERCIALS | SMALL TRADERS |
| – Percent of Open Interest Longs: | 23.2 | 53.7 | 3.8 |
| – Percent of Open Interest Shorts: | 8.9 | 68.2 | 3.7 |
| – Net Position: | 28,641 | -28,867 | 226 |
| – Gross Longs: | 46,313 | 107,155 | 7,626 |
| – Gross Shorts: | 17,672 | 136,022 | 7,400 |
| – Long to Short Ratio: | 2.6 to 1 | 0.8 to 1 | 1.0 to 1 |
| NET POSITION TREND: | |||
| – Strength Index Score (3 Year Range Pct): | 63.6 | 43.0 | 1.6 |
| – Strength Index Reading (3 Year Range): | Bullish | Bearish | Bearish-Extreme |
| NET POSITION MOVEMENT INDEX: | |||
| – 6-Week Change in Strength Index: | -15.8 | 17.7 | -11.8 |
SOYBEANS Futures:
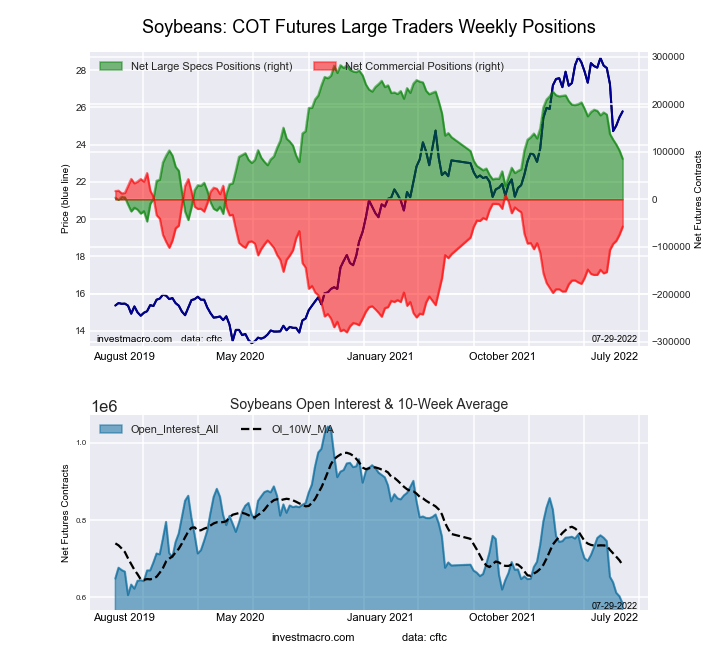
The SOYBEANS large speculator standing this week recorded a net position of 85,241 contracts in the data reported through Tuesday. This was a weekly reduction of -17,352 contracts from the previous week which had a total of 102,593 net contracts.
This week’s current strength score (the trader positioning range over the past three years, measured from 0 to 100) shows the speculators are currently Bearish with a score of 40.1 percent. The commercials are Bullish with a score of 66.3 percent and the small traders (not shown in chart) are Bearish with a score of 24.3 percent.
| SOYBEANS Futures Statistics | SPECULATORS | COMMERCIALS | SMALL TRADERS |
| – Percent of Open Interest Longs: | 24.6 | 54.3 | 6.4 |
| – Percent of Open Interest Shorts: | 10.0 | 64.2 | 11.2 |
| – Net Position: | 85,241 | -57,573 | -27,668 |
| – Gross Longs: | 143,708 | 317,204 | 37,501 |
| – Gross Shorts: | 58,467 | 374,777 | 65,169 |
| – Long to Short Ratio: | 2.5 to 1 | 0.8 to 1 | 0.6 to 1 |
| NET POSITION TREND: | |||
| – Strength Index Score (3 Year Range Pct): | 40.1 | 66.3 | 24.3 |
| – Strength Index Reading (3 Year Range): | Bearish | Bullish | Bearish |
| NET POSITION MOVEMENT INDEX: | |||
| – 6-Week Change in Strength Index: | -29.6 | 29.3 | -1.1 |
SOYBEAN OIL Futures:
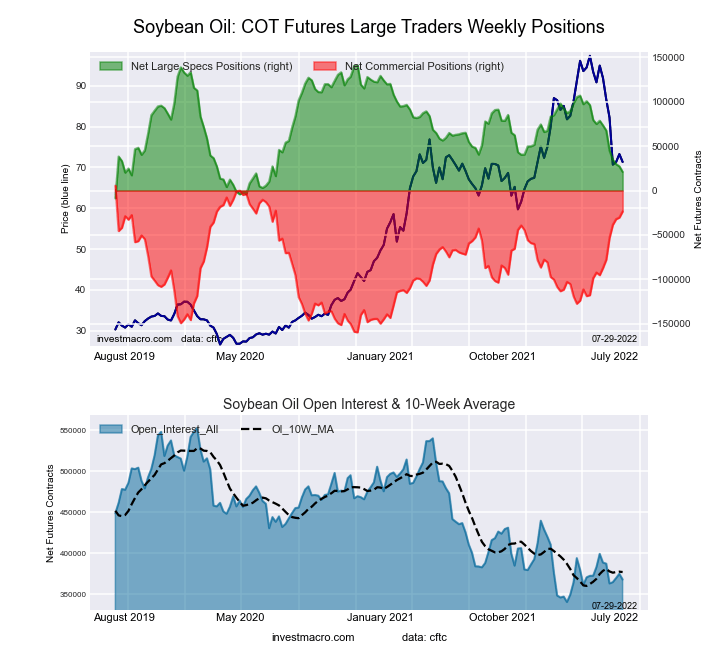
The SOYBEAN OIL large speculator standing this week recorded a net position of 21,030 contracts in the data reported through Tuesday. This was a weekly reduction of -6,295 contracts from the previous week which had a total of 27,325 net contracts.
This week’s current strength score (the trader positioning range over the past three years, measured from 0 to 100) shows the speculators are currently Bearish-Extreme with a score of 19.9 percent. The commercials are Bullish-Extreme with a score of 82.4 percent and the small traders (not shown in chart) are Bearish with a score of 22.6 percent.
| SOYBEAN OIL Futures Statistics | SPECULATORS | COMMERCIALS | SMALL TRADERS |
| – Percent of Open Interest Longs: | 17.5 | 59.4 | 6.9 |
| – Percent of Open Interest Shorts: | 11.8 | 65.8 | 6.3 |
| – Net Position: | 21,030 | -23,477 | 2,447 |
| – Gross Longs: | 64,485 | 218,590 | 25,574 |
| – Gross Shorts: | 43,455 | 242,067 | 23,127 |
| – Long to Short Ratio: | 1.5 to 1 | 0.9 to 1 | 1.1 to 1 |
| NET POSITION TREND: | |||
| – Strength Index Score (3 Year Range Pct): | 19.9 | 82.4 | 22.6 |
| – Strength Index Reading (3 Year Range): | Bearish-Extreme | Bullish-Extreme | Bearish |
| NET POSITION MOVEMENT INDEX: | |||
| – 6-Week Change in Strength Index: | -34.9 | 38.5 | -42.0 |
SOYBEAN MEAL Futures:
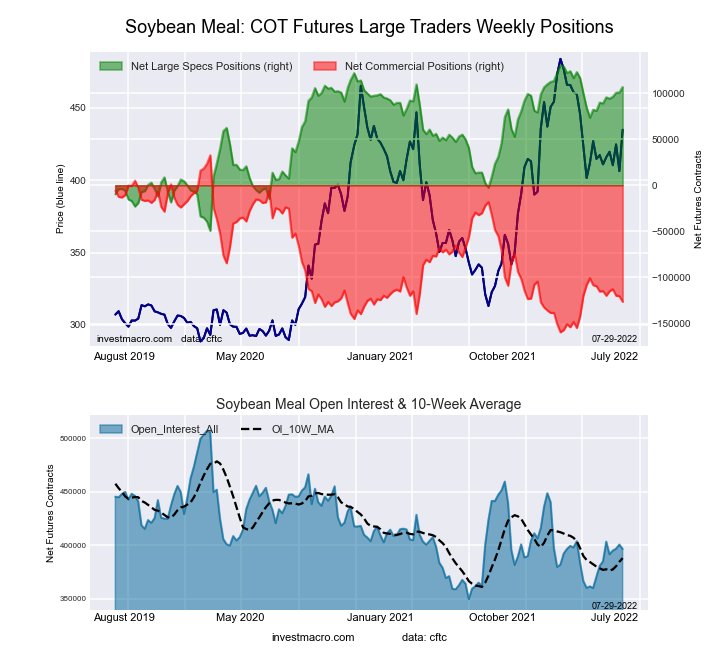
The SOYBEAN MEAL large speculator standing this week recorded a net position of 106,507 contracts in the data reported through Tuesday. This was a weekly advance of 5,833 contracts from the previous week which had a total of 100,674 net contracts.
This week’s current strength score (the trader positioning range over the past three years, measured from 0 to 100) shows the speculators are currently Bullish-Extreme with a score of 86.8 percent. The commercials are Bearish-Extreme with a score of 17.2 percent and the small traders (not shown in chart) are Bearish with a score of 36.0 percent.
| SOYBEAN MEAL Futures Statistics | SPECULATORS | COMMERCIALS | SMALL TRADERS |
| – Percent of Open Interest Longs: | 29.8 | 41.0 | 11.5 |
| – Percent of Open Interest Shorts: | 3.0 | 72.9 | 6.5 |
| – Net Position: | 106,507 | -126,394 | 19,887 |
| – Gross Longs: | 118,336 | 162,661 | 45,699 |
| – Gross Shorts: | 11,829 | 289,055 | 25,812 |
| – Long to Short Ratio: | 10.0 to 1 | 0.6 to 1 | 1.8 to 1 |
| NET POSITION TREND: | |||
| – Strength Index Score (3 Year Range Pct): | 86.8 | 17.2 | 36.0 |
| – Strength Index Reading (3 Year Range): | Bullish-Extreme | Bearish-Extreme | Bearish |
| NET POSITION MOVEMENT INDEX: | |||
| – 6-Week Change in Strength Index: | 9.8 | -6.1 | -31.1 |
LIVE CATTLE Futures:
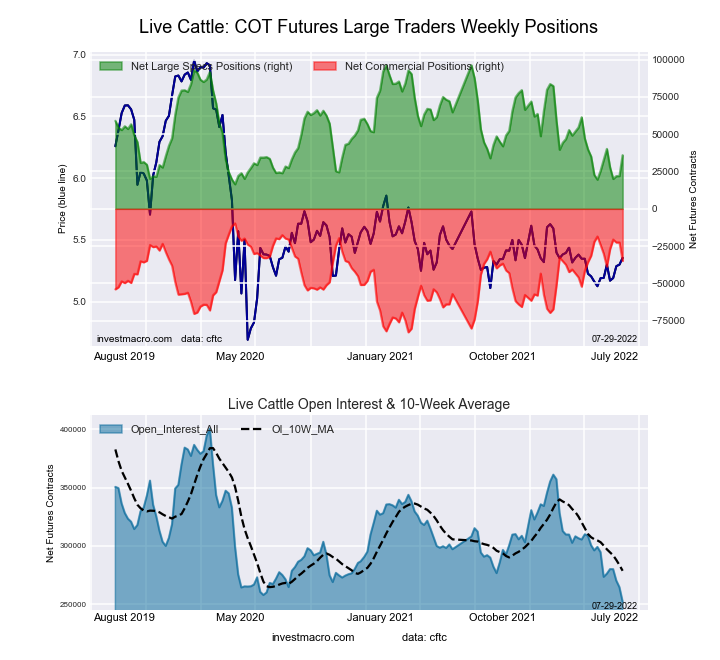
The LIVE CATTLE large speculator standing this week recorded a net position of 35,927 contracts in the data reported through Tuesday. This was a weekly rise of 13,971 contracts from the previous week which had a total of 21,956 net contracts.
This week’s current strength score (the trader positioning range over the past three years, measured from 0 to 100) shows the speculators are currently Bearish with a score of 24.4 percent. The commercials are Bullish with a score of 65.5 percent and the small traders (not shown in chart) are Bullish with a score of 78.2 percent.
| LIVE CATTLE Futures Statistics | SPECULATORS | COMMERCIALS | SMALL TRADERS |
| – Percent of Open Interest Longs: | 35.6 | 38.7 | 12.3 |
| – Percent of Open Interest Shorts: | 21.4 | 52.6 | 12.7 |
| – Net Position: | 35,927 | -34,885 | -1,042 |
| – Gross Longs: | 89,822 | 97,766 | 30,957 |
| – Gross Shorts: | 53,895 | 132,651 | 31,999 |
| – Long to Short Ratio: | 1.7 to 1 | 0.7 to 1 | 1.0 to 1 |
| NET POSITION TREND: | |||
| – Strength Index Score (3 Year Range Pct): | 24.4 | 65.5 | 78.2 |
| – Strength Index Reading (3 Year Range): | Bearish | Bullish | Bullish |
| NET POSITION MOVEMENT INDEX: | |||
| – 6-Week Change in Strength Index: | 4.0 | -6.5 | 5.5 |
LEAN HOGS Futures:
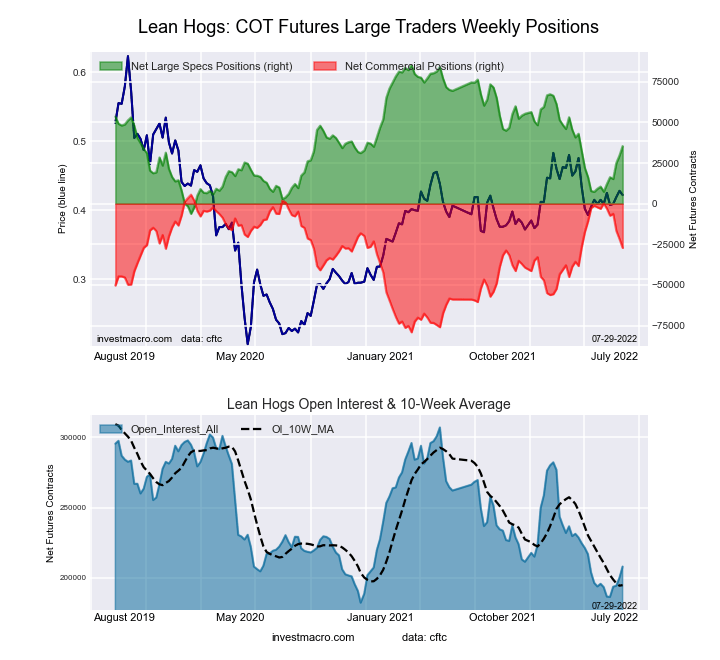
The LEAN HOGS large speculator standing this week recorded a net position of 35,421 contracts in the data reported through Tuesday. This was a weekly advance of 5,802 contracts from the previous week which had a total of 29,619 net contracts.
This week’s current strength score (the trader positioning range over the past three years, measured from 0 to 100) shows the speculators are currently Bearish with a score of 45.3 percent. The commercials are Bullish with a score of 61.3 percent and the small traders (not shown in chart) are Bullish with a score of 53.8 percent.
| LEAN HOGS Futures Statistics | SPECULATORS | COMMERCIALS | SMALL TRADERS |
| – Percent of Open Interest Longs: | 38.0 | 35.1 | 9.6 |
| – Percent of Open Interest Shorts: | 21.0 | 48.2 | 13.6 |
| – Net Position: | 35,421 | -27,182 | -8,239 |
| – Gross Longs: | 79,022 | 73,074 | 19,948 |
| – Gross Shorts: | 43,601 | 100,256 | 28,187 |
| – Long to Short Ratio: | 1.8 to 1 | 0.7 to 1 | 0.7 to 1 |
| NET POSITION TREND: | |||
| – Strength Index Score (3 Year Range Pct): | 45.3 | 61.3 | 53.8 |
| – Strength Index Reading (3 Year Range): | Bearish | Bullish | Bullish |
| NET POSITION MOVEMENT INDEX: | |||
| – 6-Week Change in Strength Index: | 30.5 | -32.4 | -3.4 |
COTTON Futures:
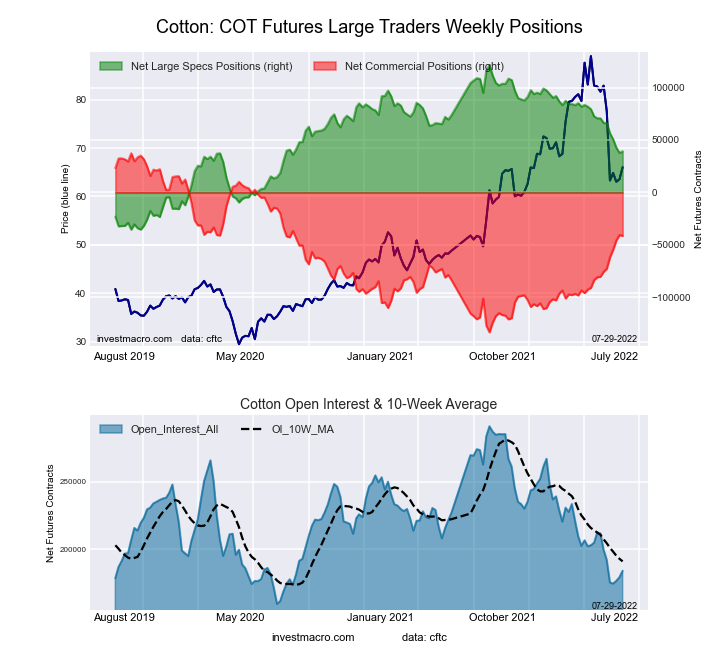
The COTTON large speculator standing this week recorded a net position of 39,198 contracts in the data reported through Tuesday. This was a weekly rise of 1,447 contracts from the previous week which had a total of 37,751 net contracts.
This week’s current strength score (the trader positioning range over the past three years, measured from 0 to 100) shows the speculators are currently Bearish with a score of 47.6 percent. The commercials are Bullish with a score of 53.9 percent and the small traders (not shown in chart) are Bearish with a score of 26.1 percent.
| COTTON Futures Statistics | SPECULATORS | COMMERCIALS | SMALL TRADERS |
| – Percent of Open Interest Longs: | 37.3 | 45.5 | 6.4 |
| – Percent of Open Interest Shorts: | 15.9 | 68.0 | 5.2 |
| – Net Position: | 39,198 | -41,405 | 2,207 |
| – Gross Longs: | 68,502 | 83,618 | 11,696 |
| – Gross Shorts: | 29,304 | 125,023 | 9,489 |
| – Long to Short Ratio: | 2.3 to 1 | 0.7 to 1 | 1.2 to 1 |
| NET POSITION TREND: | |||
| – Strength Index Score (3 Year Range Pct): | 47.6 | 53.9 | 26.1 |
| – Strength Index Reading (3 Year Range): | Bearish | Bullish | Bearish |
| NET POSITION MOVEMENT INDEX: | |||
| – 6-Week Change in Strength Index: | -17.3 | 20.1 | -45.7 |
COCOA Futures:
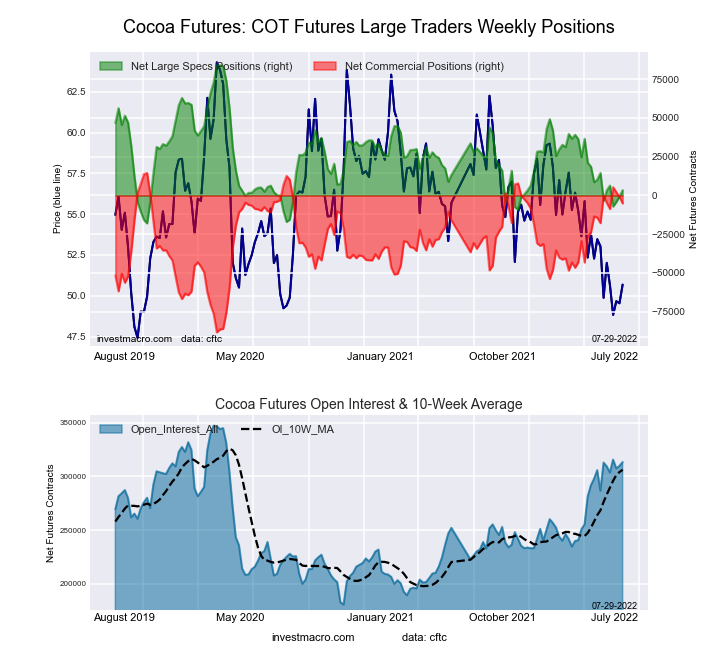
The COCOA large speculator standing this week recorded a net position of 3,408 contracts in the data reported through Tuesday. This was a weekly rise of 4,010 contracts from the previous week which had a total of -602 net contracts.
This week’s current strength score (the trader positioning range over the past three years, measured from 0 to 100) shows the speculators are currently Bearish with a score of 21.0 percent. The commercials are Bullish-Extreme with a score of 80.9 percent and the small traders (not shown in chart) are Bearish-Extreme with a score of 13.7 percent.
| COCOA Futures Statistics | SPECULATORS | COMMERCIALS | SMALL TRADERS |
| – Percent of Open Interest Longs: | 30.3 | 44.4 | 4.5 |
| – Percent of Open Interest Shorts: | 29.2 | 46.0 | 3.9 |
| – Net Position: | 3,408 | -5,134 | 1,726 |
| – Gross Longs: | 94,825 | 139,108 | 13,968 |
| – Gross Shorts: | 91,417 | 144,242 | 12,242 |
| – Long to Short Ratio: | 1.0 to 1 | 1.0 to 1 | 1.1 to 1 |
| NET POSITION TREND: | |||
| – Strength Index Score (3 Year Range Pct): | 21.0 | 80.9 | 13.7 |
| – Strength Index Reading (3 Year Range): | Bearish | Bullish-Extreme | Bearish-Extreme |
| NET POSITION MOVEMENT INDEX: | |||
| – 6-Week Change in Strength Index: | 6.6 | -4.9 | -17.7 |
WHEAT Futures:
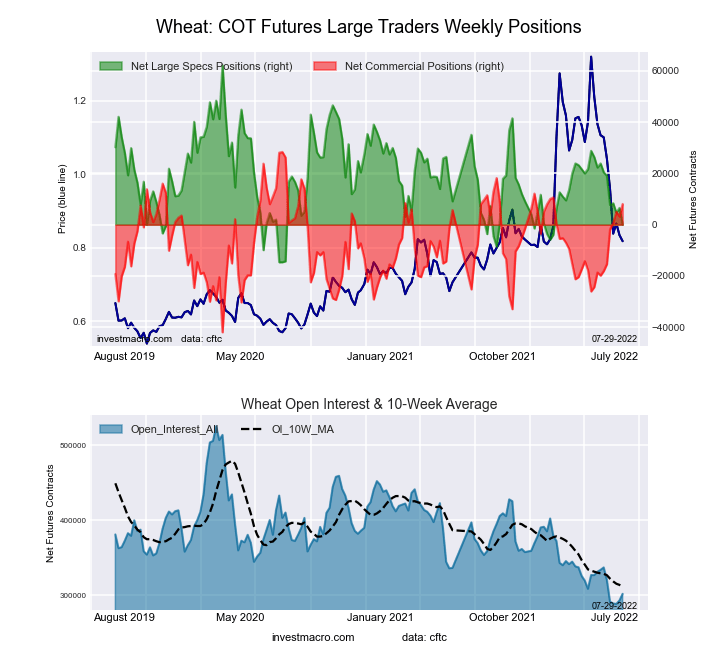
The WHEAT large speculator standing this week recorded a net position of 25 contracts in the data reported through Tuesday. This was a weekly reduction of -6,497 contracts from the previous week which had a total of 6,522 net contracts.
This week’s current strength score (the trader positioning range over the past three years, measured from 0 to 100) shows the speculators are currently Bearish-Extreme with a score of 19.1 percent. The commercials are Bullish with a score of 71.1 percent and the small traders (not shown in chart) are Bullish with a score of 68.4 percent.
| WHEAT Futures Statistics | SPECULATORS | COMMERCIALS | SMALL TRADERS |
| – Percent of Open Interest Longs: | 29.3 | 40.5 | 9.6 |
| – Percent of Open Interest Shorts: | 29.3 | 37.8 | 12.3 |
| – Net Position: | 25 | 8,068 | -8,093 |
| – Gross Longs: | 88,400 | 122,221 | 28,925 |
| – Gross Shorts: | 88,375 | 114,153 | 37,018 |
| – Long to Short Ratio: | 1.0 to 1 | 1.1 to 1 | 0.8 to 1 |
| NET POSITION TREND: | |||
| – Strength Index Score (3 Year Range Pct): | 19.1 | 71.1 | 68.4 |
| – Strength Index Reading (3 Year Range): | Bearish-Extreme | Bullish | Bullish |
| NET POSITION MOVEMENT INDEX: | |||
| – 6-Week Change in Strength Index: | -26.6 | 37.2 | -29.8 |
*COT Report: The COT data, released weekly to the public each Friday, is updated through the most recent Tuesday (data is 3 days old) and shows a quick view of how large speculators or non-commercials (for-profit traders) were positioned in the futures markets.
The CFTC categorizes trader positions according to commercial hedgers (traders who use futures contracts for hedging as part of the business), non-commercials (large traders who speculate to realize trading profits) and nonreportable traders (usually small traders/speculators) as well as their open interest (contracts open in the market at time of reporting).See CFTC criteria here.
More By This Author:
Energy Speculator Bets Go Higher Led By Natural Gas & Gasoline
Soft Commodities Speculator Bets Slightly Higher Led By Sugar, Lean Hogs & Cocoa
Stock Market Speculator Bets Mostly Higher Led By Russell 2000 & Nasdaq


Comments
Log in or sign up to join the conversation.