

Here are the latest charts and statistics for the Commitment of Traders (COT) data published by the Commodities Futures Trading Commission (CFTC).
The latest COT data is updated through Tuesday June 14th and shows a quick view of how large traders (for-profit speculators and commercial entities) were positioned in the futures markets.
The soft commodities market speculator bets were mostly lower this week as just three out of the eleven soft commodities markets we cover had higher positioning this week while eight markets had lower speculator bets.
Leading the gains for soft commodities markets was Corn (8,511 contracts) and Live Cattle (7,316 contracts) with Soybeans (6,023 contracts) also showing a positive week.
Meanwhile, leading the declines in speculator bets this week were Sugar (-24,920 contracts) and Cocoa (-17,863 contracts) with Soybean Oil (-5,247 contracts), Cotton (-4,427 contracts), Wheat (-3,446 contracts), Lean Hogs (-3,105 contracts), Coffee (-1,882 contracts) and Soybean Meal (-845 contracts) also registering lower bets on the week.
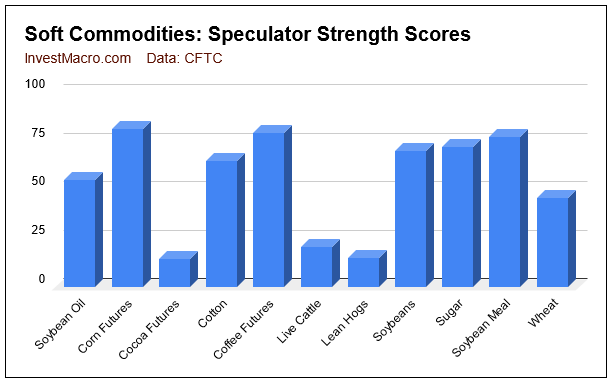
Strength scores (3-Year range of Speculator positions, from 0 to 100 where above 80 is extreme bullish and below 20 is extreme bearish) show that Corn (81.1 percent and bullish-extreme) is at the highest level of the softs currently followed by Coffee and Soybean Meal. On the downside, Lean Hogs (14.8 percent) and Cocoa (14.3 percent) are in bearish-extreme levels and have the weakest speculator strength scores at the moment.
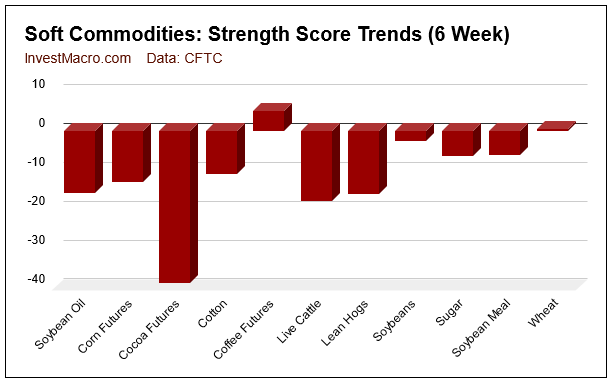
Strength score trends (or move index, that calculate 6-week changes in strength scores) shows that Coffee and Wheat have the only rising scores over the past six weeks. Cocoa leads the trends on the downside with a -39.1 percent trend change followed by Live Cattle (-17.9 percent) and Lean Hogs (-16 percent).
Data Snapshot of Commodity Market Traders | Columns Legend
| WTI Crude | 1,715,674 | 0 | 302,946 | 0 | -341,654 | 100 | 38,708 | 70 |
| Corn | 1,521,565 | 25 | 399,775 | 81 | -344,196 | 23 | -55,579 | 11 |
| Natural Gas | 1,053,265 | 0 | -123,485 | 42 | 74,310 | 54 | 49,175 | 96 |
| Sugar | 800,806 | 1 | 170,483 | 72 | -198,006 | 31 | 27,523 | 42 |
| Soybeans | 754,428 | 34 | 182,667 | 70 | -155,663 | 37 | -27,004 | 25 |
| Gold | 497,456 | 13 | 154,598 | 0 | -178,569 | 100 | 23,971 | 15 |
| Wheat | 336,890 | 13 | 20,435 | 46 | -18,089 | 34 | -2,346 | 98 |
| Heating Oil | 268,199 | 23 | 8,475 | 55 | -28,686 | 41 | 20,211 | 68 |
| Coffee | 202,656 | 0 | 46,885 | 79 | -48,399 | 25 | 1,514 | 5 |
| Copper | 187,247 | 17 | -13,797 | 32 | 10,287 | 67 | 3,510 | 46 |
| Brent | 171,026 | 17 | -36,389 | 50 | 34,601 | 51 | 1,788 | 33 |
| Silver | 151,978 | 18 | 14,005 | 0 | -22,047 | 100 | 8,042 | 0 |
| Platinum | 66,613 | 33 | 2,214 | 7 | -6,793 | 96 | 4,579 | 26 |
| Palladium | 7,740 | 6 | -4,057 | 0 | 4,354 | 100 | -297 | 27 |
CORN Futures:
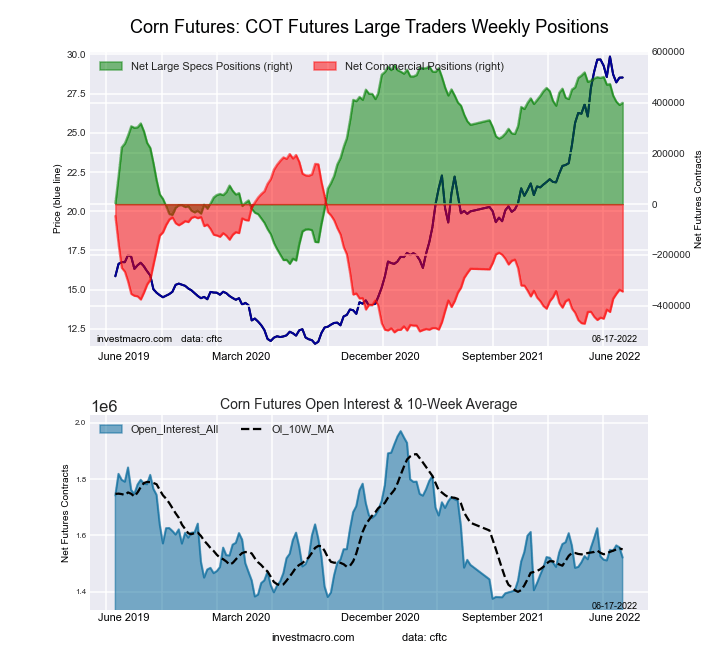
The CORN large speculator standing this week was a net position of 399,775 contracts in the data reported through Tuesday. This was a weekly increase of 8,511 contracts from the previous week which had a total of 391,264 net contracts.
This week’s current strength score (the trader positioning range over the past three years, measured from 0 to 100) shows the speculators are currently Bullish-Extreme with a score of 81.1 percent. The commercials are Bearish with a score of 22.9 percent and the small traders (not shown in chart) are Bearish-Extreme with a score of 11.1 percent.
| CORN Futures Statistics | SPECULATORS | COMMERCIALS | SMALL TRADERS |
| – Percent of Open Interest Longs: | 34.2 | 44.6 | 9.2 |
| – Percent of Open Interest Shorts: | 7.9 | 67.2 | 12.8 |
| – Net Position: | 399,775 | -344,196 | -55,579 |
| – Gross Longs: | 519,685 | 678,186 | 139,407 |
| – Gross Shorts: | 119,910 | 1,022,382 | 194,986 |
| – Long to Short Ratio: | 4.3 to 1 | 0.7 to 1 | 0.7 to 1 |
| NET POSITION TREND: | |||
| – Strength Index Score (3 Year Range Pct): | 81.1 | 22.9 | 11.1 |
| – Strength Index Reading (3 Year Range): | Bullish-Extreme | Bearish | Bearish-Extreme |
| NET POSITION MOVEMENT INDEX: | |||
| – 6-Week Change in Strength Index: | -13.0 | 15.2 | -2.8 |
SUGAR Futures:
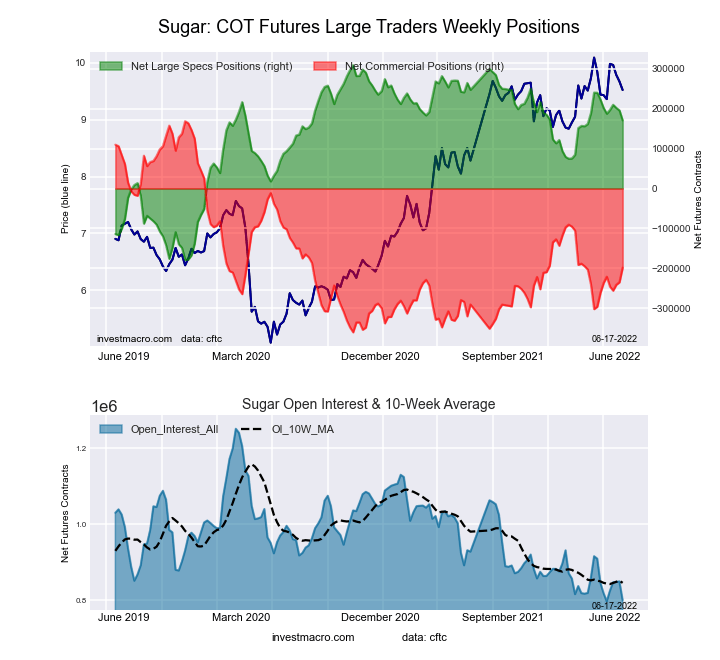
The SUGAR large speculator standing this week was a net position of 170,483 contracts in the data reported through Tuesday. This was a weekly decrease of -24,920 contracts from the previous week which had a total of 195,403 net contracts.
This week’s current strength score (the trader positioning range over the past three years, measured from 0 to 100) shows the speculators are currently Bullish with a score of 71.7 percent. The commercials are Bearish with a score of 30.6 percent and the small traders (not shown in chart) are Bearish with a score of 41.9 percent.
| SUGAR Futures Statistics | SPECULATORS | COMMERCIALS | SMALL TRADERS |
| – Percent of Open Interest Longs: | 29.1 | 47.6 | 10.1 |
| – Percent of Open Interest Shorts: | 7.8 | 72.3 | 6.7 |
| – Net Position: | 170,483 | -198,006 | 27,523 |
| – Gross Longs: | 233,102 | 380,876 | 80,955 |
| – Gross Shorts: | 62,619 | 578,882 | 53,432 |
| – Long to Short Ratio: | 3.7 to 1 | 0.7 to 1 | 1.5 to 1 |
| NET POSITION TREND: | |||
| – Strength Index Score (3 Year Range Pct): | 71.7 | 30.6 | 41.9 |
| – Strength Index Reading (3 Year Range): | Bullish | Bearish | Bearish |
| NET POSITION MOVEMENT INDEX: | |||
| – 6-Week Change in Strength Index: | -6.4 | 7.3 | -9.0 |
COFFEE Futures:
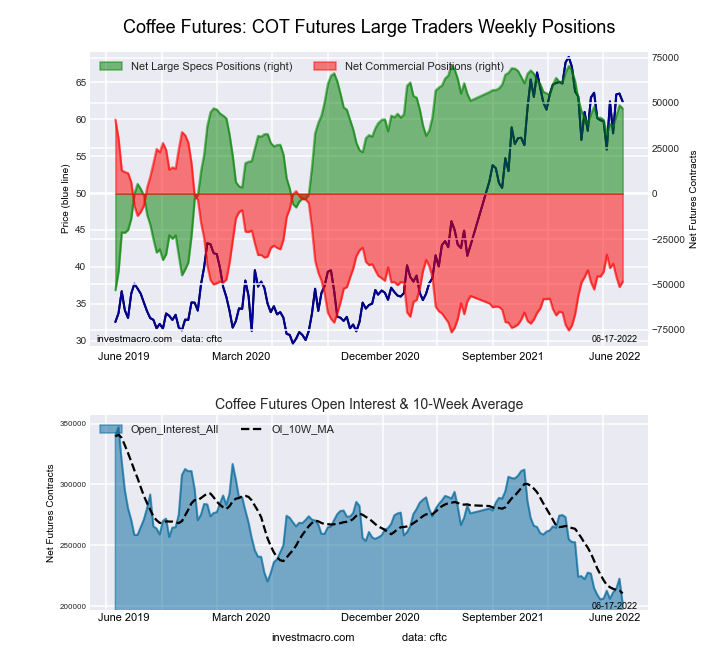
The COFFEE large speculator standing this week was a net position of 46,885 contracts in the data reported through Tuesday. This was a weekly decline of -1,882 contracts from the previous week which had a total of 48,767 net contracts.
This week’s current strength score (the trader positioning range over the past three years, measured from 0 to 100) shows the speculators are currently Bullish with a score of 79.3 percent. The commercials are Bearish with a score of 25.3 percent and the small traders (not shown in chart) are Bearish-Extreme with a score of 5.1 percent.
| COFFEE Futures Statistics | SPECULATORS | COMMERCIALS | SMALL TRADERS |
| – Percent of Open Interest Longs: | 27.3 | 49.4 | 4.4 |
| – Percent of Open Interest Shorts: | 4.2 | 73.3 | 3.6 |
| – Net Position: | 46,885 | -48,399 | 1,514 |
| – Gross Longs: | 55,397 | 100,060 | 8,883 |
| – Gross Shorts: | 8,512 | 148,459 | 7,369 |
| – Long to Short Ratio: | 6.5 to 1 | 0.7 to 1 | 1.2 to 1 |
| NET POSITION TREND: | |||
| – Strength Index Score (3 Year Range Pct): | 79.3 | 25.3 | 5.1 |
| – Strength Index Reading (3 Year Range): | Bullish | Bearish | Bearish-Extreme |
| NET POSITION MOVEMENT INDEX: | |||
| – 6-Week Change in Strength Index: | 5.3 | -4.9 | -8.0 |
SOYBEANS Futures:
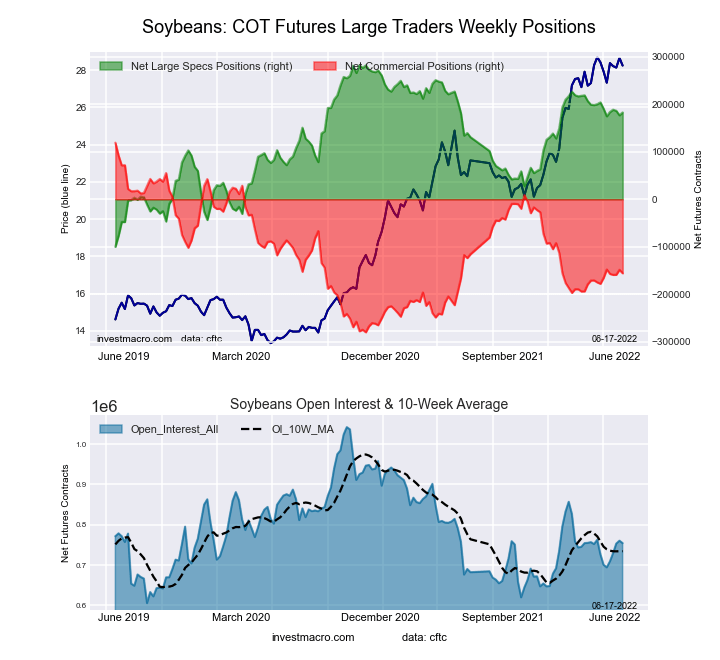
The SOYBEANS large speculator standing this week was a net position of 182,667 contracts in the data reported through Tuesday. This was a weekly boost of 6,023 contracts from the previous week which had a total of 176,644 net contracts.
This week’s current strength score (the trader positioning range over the past three years, measured from 0 to 100) shows the speculators are currently Bullish with a score of 69.8 percent. The commercials are Bearish with a score of 37.1 percent and the small traders (not shown in chart) are Bearish with a score of 25.4 percent.
| SOYBEANS Futures Statistics | SPECULATORS | COMMERCIALS | SMALL TRADERS |
| – Percent of Open Interest Longs: | 30.5 | 49.3 | 6.6 |
| – Percent of Open Interest Shorts: | 6.3 | 69.9 | 10.2 |
| – Net Position: | 182,667 | -155,663 | -27,004 |
| – Gross Longs: | 229,930 | 371,675 | 50,027 |
| – Gross Shorts: | 47,263 | 527,338 | 77,031 |
| – Long to Short Ratio: | 4.9 to 1 | 0.7 to 1 | 0.6 to 1 |
| NET POSITION TREND: | |||
| – Strength Index Score (3 Year Range Pct): | 69.8 | 37.1 | 25.4 |
| – Strength Index Reading (3 Year Range): | Bullish | Bearish | Bearish |
| NET POSITION MOVEMENT INDEX: | |||
| – 6-Week Change in Strength Index: | -2.4 | 2.9 | -3.3 |
SOYBEAN OIL Futures:
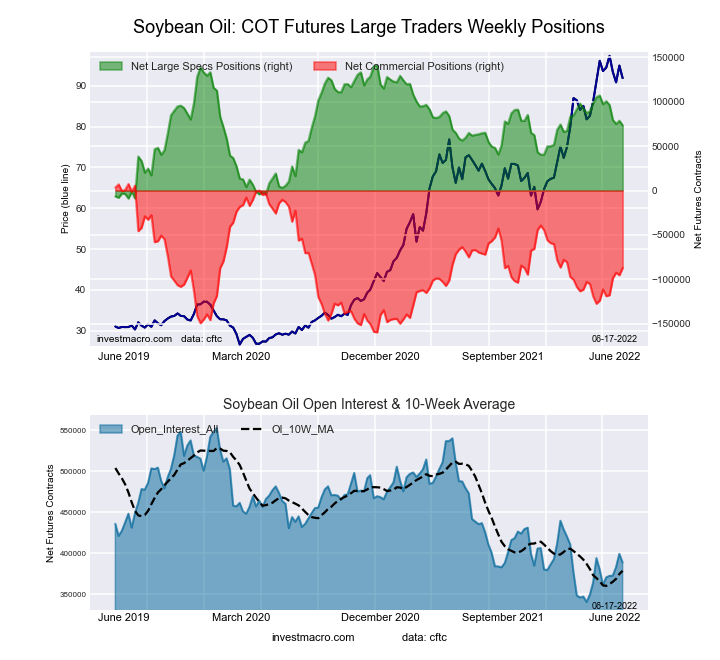
The SOYBEAN OIL large speculator standing this week was a net position of 73,398 contracts in the data reported through Tuesday. This was a weekly fall of -5,247 contracts from the previous week which had a total of 78,645 net contracts.
This week’s current strength score (the trader positioning range over the past three years, measured from 0 to 100) shows the speculators are currently Bullish with a score of 54.8 percent. The commercials are Bearish with a score of 43.4 percent and the small traders (not shown in chart) are Bullish with a score of 64.6 percent.
| SOYBEAN OIL Futures Statistics | SPECULATORS | COMMERCIALS | SMALL TRADERS |
| – Percent of Open Interest Longs: | 26.3 | 50.9 | 9.1 |
| – Percent of Open Interest Shorts: | 7.4 | 73.4 | 5.5 |
| – Net Position: | 73,398 | -87,101 | 13,703 |
| – Gross Longs: | 102,073 | 198,015 | 35,202 |
| – Gross Shorts: | 28,675 | 285,116 | 21,499 |
| – Long to Short Ratio: | 3.6 to 1 | 0.7 to 1 | 1.6 to 1 |
| NET POSITION TREND: | |||
| – Strength Index Score (3 Year Range Pct): | 54.8 | 43.4 | 64.6 |
| – Strength Index Reading (3 Year Range): | Bullish | Bearish | Bullish |
| NET POSITION MOVEMENT INDEX: | |||
| – 6-Week Change in Strength Index: | -15.9 | 14.5 | -1.0 |
SOYBEAN MEAL Futures:
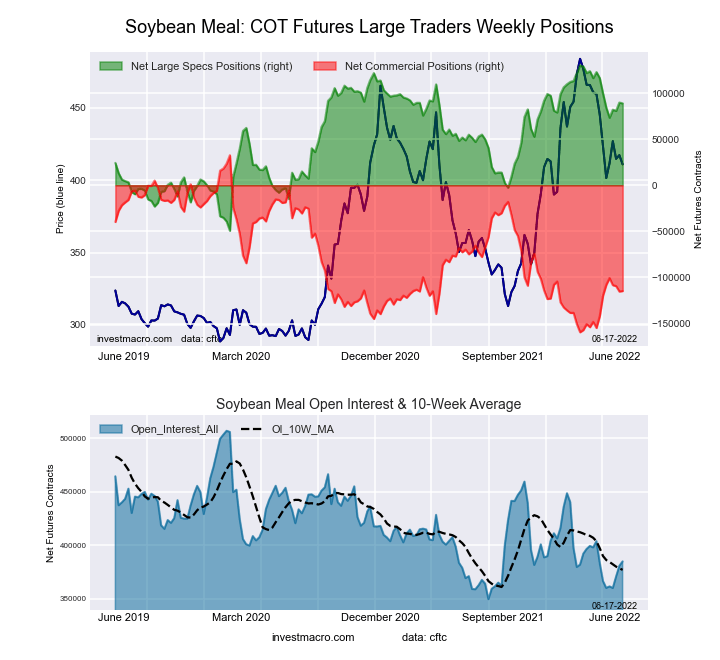
The SOYBEAN MEAL large speculator standing this week was a net position of 88,831 contracts in the data reported through Tuesday. This was a weekly fall of -845 contracts from the previous week which had a total of 89,676 net contracts.
This week’s current strength score (the trader positioning range over the past three years, measured from 0 to 100) shows the speculators are currently Bullish with a score of 76.9 percent. The commercials are Bearish with a score of 23.3 percent and the small traders (not shown in chart) are Bullish with a score of 67.5 percent.
| SOYBEAN MEAL Futures Statistics | SPECULATORS | COMMERCIALS | SMALL TRADERS |
| – Percent of Open Interest Longs: | 27.6 | 43.8 | 12.7 |
| – Percent of Open Interest Shorts: | 4.5 | 73.6 | 5.9 |
| – Net Position: | 88,831 | -114,735 | 25,904 |
| – Gross Longs: | 106,273 | 168,517 | 48,694 |
| – Gross Shorts: | 17,442 | 283,252 | 22,790 |
| – Long to Short Ratio: | 6.1 to 1 | 0.6 to 1 | 2.1 to 1 |
| NET POSITION TREND: | |||
| – Strength Index Score (3 Year Range Pct): | 76.9 | 23.3 | 67.5 |
| – Strength Index Reading (3 Year Range): | Bullish | Bearish | Bullish |
| NET POSITION MOVEMENT INDEX: | |||
| – 6-Week Change in Strength Index: | -6.0 | 2.6 | 29.3 |
LIVE CATTLE Futures:
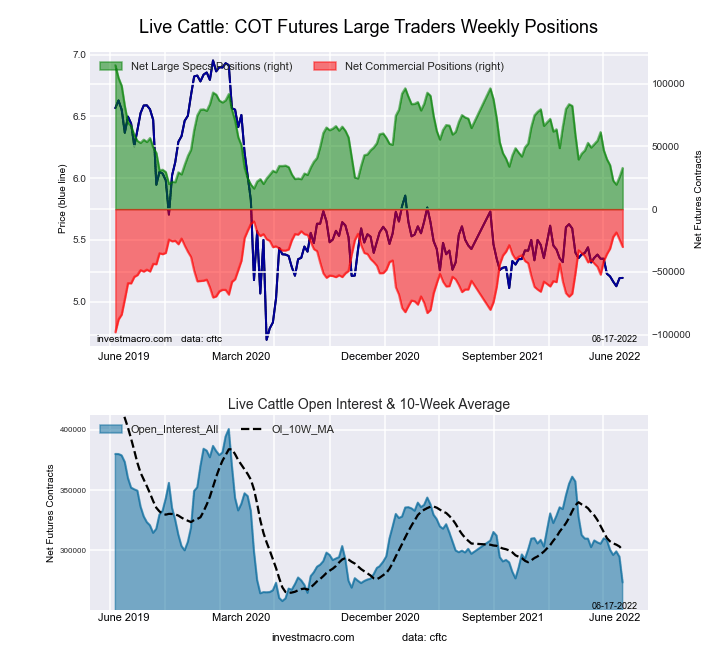
The LIVE CATTLE large speculator standing this week was a net position of 32,744 contracts in the data reported through Tuesday. This was a weekly gain of 7,316 contracts from the previous week which had a total of 25,428 net contracts.
This week’s current strength score (the trader positioning range over the past three years, measured from 0 to 100) shows the speculators are currently Bearish with a score of 20.4 percent. The commercials are Bullish with a score of 72.1 percent and the small traders (not shown in chart) are Bullish with a score of 72.7 percent.
| LIVE CATTLE Futures Statistics | SPECULATORS | COMMERCIALS | SMALL TRADERS |
| – Percent of Open Interest Longs: | 36.9 | 40.6 | 11.3 |
| – Percent of Open Interest Shorts: | 24.9 | 51.6 | 12.3 |
| – Net Position: | 32,744 | -30,120 | -2,624 |
| – Gross Longs: | 100,918 | 110,947 | 30,976 |
| – Gross Shorts: | 68,174 | 141,067 | 33,600 |
| – Long to Short Ratio: | 1.5 to 1 | 0.8 to 1 | 0.9 to 1 |
| NET POSITION TREND: | |||
| – Strength Index Score (3 Year Range Pct): | 20.4 | 72.1 | 72.7 |
| – Strength Index Reading (3 Year Range): | Bearish | Bullish | Bullish |
| NET POSITION MOVEMENT INDEX: | |||
| – 6-Week Change in Strength Index: | -17.9 | 15.4 | 10.5 |
LEAN HOGS Futures:
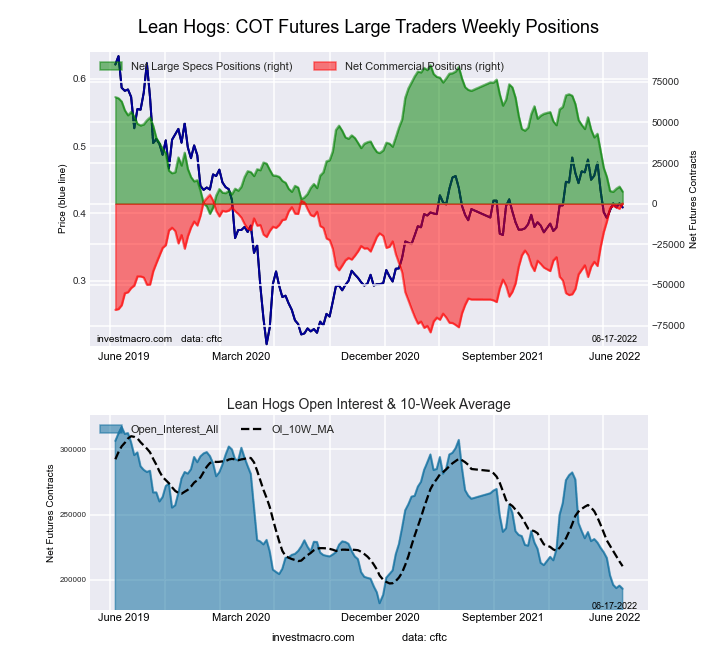
The LEAN HOGS large speculator standing this week was a net position of 7,386 contracts in the data reported through Tuesday. This was a weekly lowering of -3,105 contracts from the previous week which had a total of 10,491 net contracts.
This week’s current strength score (the trader positioning range over the past three years, measured from 0 to 100) shows the speculators are currently Bearish-Extreme with a score of 14.8 percent. The commercials are Bullish-Extreme with a score of 93.7 percent and the small traders (not shown in chart) are Bullish with a score of 57.2 percent.
| LEAN HOGS Futures Statistics | SPECULATORS | COMMERCIALS | SMALL TRADERS |
| – Percent of Open Interest Longs: | 29.7 | 43.9 | 9.9 |
| – Percent of Open Interest Shorts: | 25.8 | 43.8 | 13.8 |
| – Net Position: | 7,386 | 202 | -7,588 |
| – Gross Longs: | 57,305 | 84,837 | 19,098 |
| – Gross Shorts: | 49,919 | 84,635 | 26,686 |
| – Long to Short Ratio: | 1.1 to 1 | 1.0 to 1 | 0.7 to 1 |
| NET POSITION TREND: | |||
| – Strength Index Score (3 Year Range Pct): | 14.8 | 93.7 | 57.2 |
| – Strength Index Reading (3 Year Range): | Bearish-Extreme | Bullish-Extreme | Bullish |
| NET POSITION MOVEMENT INDEX: | |||
| – 6-Week Change in Strength Index: | -16.0 | 20.7 | -15.1 |
COTTON Futures:
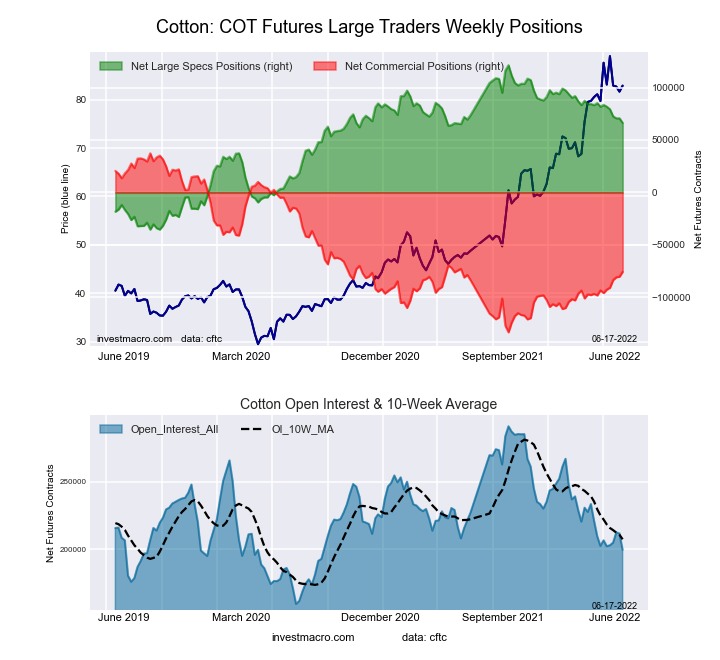
The COTTON large speculator standing this week was a net position of 66,255 contracts in the data reported through Tuesday. This was a weekly lowering of -4,427 contracts from the previous week which had a total of 70,682 net contracts.
This week’s current strength score (the trader positioning range over the past three years, measured from 0 to 100) shows the speculators are currently Bullish with a score of 64.9 percent. The commercials are Bearish with a score of 33.8 percent and the small traders (not shown in chart) are Bullish with a score of 71.8 percent.
| COTTON Futures Statistics | SPECULATORS | COMMERCIALS | SMALL TRADERS |
| – Percent of Open Interest Longs: | 41.1 | 41.6 | 9.2 |
| – Percent of Open Interest Shorts: | 7.9 | 79.5 | 4.5 |
| – Net Position: | 66,255 | -75,657 | 9,402 |
| – Gross Longs: | 81,941 | 82,992 | 18,322 |
| – Gross Shorts: | 15,686 | 158,649 | 8,920 |
| – Long to Short Ratio: | 5.2 to 1 | 0.5 to 1 | 2.1 to 1 |
| NET POSITION TREND: | |||
| – Strength Index Score (3 Year Range Pct): | 64.9 | 33.8 | 71.8 |
| – Strength Index Reading (3 Year Range): | Bullish | Bearish | Bullish |
| NET POSITION MOVEMENT INDEX: | |||
| – 6-Week Change in Strength Index: | -11.0 | 11.9 | -19.5 |
COCOA Futures:
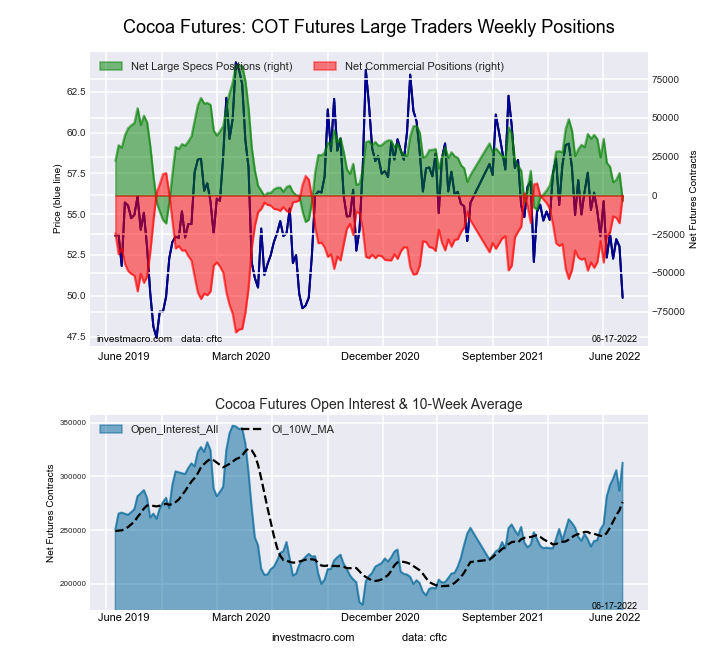
The COCOA large speculator standing this week was a net position of -3,369 contracts in the data reported through Tuesday. This was a weekly fall of -17,863 contracts from the previous week which had a total of 14,494 net contracts.
This week’s current strength score (the trader positioning range over the past three years, measured from 0 to 100) shows the speculators are currently Bearish-Extreme with a score of 14.3 percent. The commercials are Bullish-Extreme with a score of 85.8 percent and the small traders (not shown in chart) are Bearish with a score of 31.5 percent.
| COCOA Futures Statistics | SPECULATORS | COMMERCIALS | SMALL TRADERS |
| – Percent of Open Interest Longs: | 29.0 | 45.5 | 5.9 |
| – Percent of Open Interest Shorts: | 30.1 | 45.5 | 4.8 |
| – Net Position: | -3,369 | -126 | 3,495 |
| – Gross Longs: | 90,712 | 142,236 | 18,389 |
| – Gross Shorts: | 94,081 | 142,362 | 14,894 |
| – Long to Short Ratio: | 1.0 to 1 | 1.0 to 1 | 1.2 to 1 |
| NET POSITION TREND: | |||
| – Strength Index Score (3 Year Range Pct): | 14.3 | 85.8 | 31.5 |
| – Strength Index Reading (3 Year Range): | Bearish-Extreme | Bullish-Extreme | Bearish |
| NET POSITION MOVEMENT INDEX: | |||
| – 6-Week Change in Strength Index: | -39.1 | 42.0 | -32.3 |
WHEAT Futures:
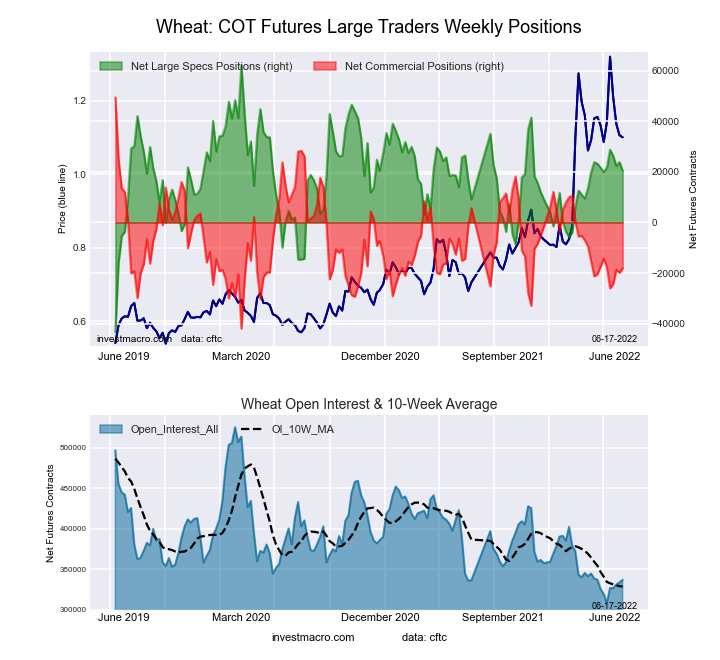
The WHEAT large speculator standing this week was a net position of 20,435 contracts in the data reported through Tuesday. This was a weekly reduction of -3,446 contracts from the previous week which had a total of 23,881 net contracts.
This week’s current strength score (the trader positioning range over the past three years, measured from 0 to 100) shows the speculators are currently Bearish with a score of 45.6 percent. The commercials are Bearish with a score of 33.9 percent and the small traders (not shown in chart) are Bullish-Extreme with a score of 98.2 percent.
| WHEAT Futures Statistics | SPECULATORS | COMMERCIALS | SMALL TRADERS |
| – Percent of Open Interest Longs: | 31.3 | 38.0 | 10.7 |
| – Percent of Open Interest Shorts: | 25.3 | 43.4 | 11.4 |
| – Net Position: | 20,435 | -18,089 | -2,346 |
| – Gross Longs: | 105,566 | 128,087 | 36,114 |
| – Gross Shorts: | 85,131 | 146,176 | 38,460 |
| – Long to Short Ratio: | 1.2 to 1 | 0.9 to 1 | 0.9 to 1 |
| NET POSITION TREND: | |||
| – Strength Index Score (3 Year Range Pct): | 45.6 | 33.9 | 98.2 |
| – Strength Index Reading (3 Year Range): | Bearish | Bearish | Bullish-Extreme |
| NET POSITION MOVEMENT INDEX: | |||
| – 6-Week Change in Strength Index: | 0.6 | -5.5 | 17.9 |
*COT Report: The COT data, released weekly to the public each Friday, is updated through the most recent Tuesday (data is 3 days old) and shows a quick view of how large speculators or non-commercials (for-profit traders) were positioned in the futures markets.
The CFTC categorizes trader positions according to commercial hedgers (traders who use futures contracts for hedging as part of the business), non-commercials (large traders who speculate to realize trading profits) and nonreportable traders (usually small traders/speculators) as well as their open interest (contracts open in the market at time of reporting).See CFTC criteria here.


Comments
Log in or sign up to join the conversation.