

Here are the latest charts and statistics for the Commitment of Traders (COT) data published by the Commodities Futures Trading Commission (CFTC).
The latest COT data is updated through Tuesday June 7th and shows a quick view of how large traders (for-profit speculators and commercial entities) were positioned in the futures markets.
COT metals market speculator bets were mostly rising this week as five out of the six metals markets we cover had higher positioning this week while only one market had lower contracts.
Leading the gains for the precious metals markets was Copper (14,311 contracts) and Platinum (3,570 contracts) with Silver (3,407 contracts) and Gold (2,679 contracts) also showing a positive week. Meanwhile, the only market with declines in speculator bets this week was Palladium with a fall of -328 contracts.
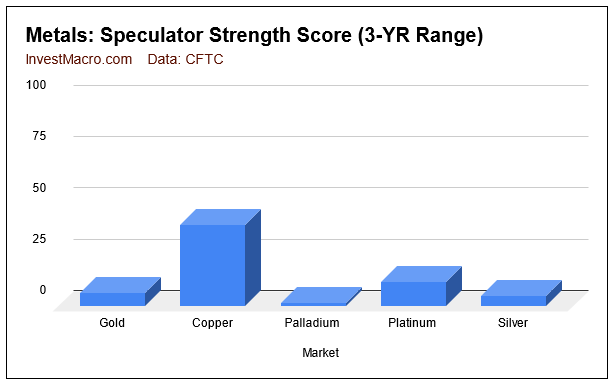
Strength scores (3-Year range of Speculator positions, from 0 to 100 where above 80 is extreme bullish and below 20 is extreme bearish) show that only Copper (39.7 percent) is not in an extreme-bearish position at the current time. Using the Strength Index as a contrarian signal, the metals markets could be at attractive levels depending on the fundamental and technical factors of each market.
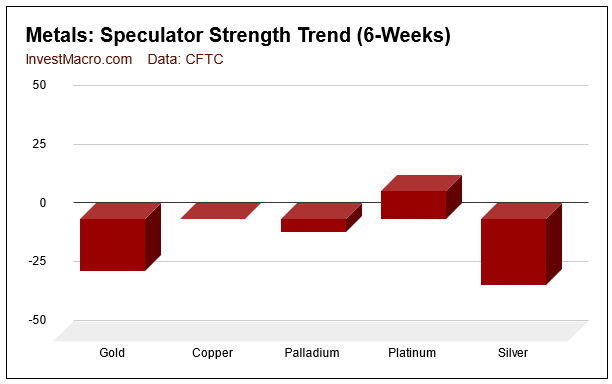
Strength score trends (or move index, that calculate 6-week changes in strength scores) shows that only Platinum has been trending higher over the past six weeks. On the downside, Silver and the Gold have shown the largest downward trends.
Data Snapshot of Commodity Market Traders | Columns Legend
| WTI Crude | 1,790,618 | 10 | 328,256 | 8 | -369,033 | 93 | 40,777 | 72 |
| Corn | 1,557,167 | 31 | 391,264 | 80 | -337,137 | 24 | -54,127 | 12 |
| Natural Gas | 1,127,731 | 10 | -114,342 | 44 | 66,419 | 52 | 47,923 | 93 |
| Sugar | 849,814 | 12 | 195,403 | 77 | -234,496 | 24 | 39,093 | 56 |
| Soybeans | 760,444 | 35 | 176,644 | 68 | -148,390 | 39 | -28,254 | 23 |
| Gold | 494,130 | 12 | 175,268 | 7 | -199,886 | 95 | 24,618 | 18 |
| Wheat | 333,705 | 12 | 23,881 | 50 | -19,863 | 31 | -4,018 | 90 |
| Heating Oil | 261,651 | 20 | 4,886 | 50 | -24,428 | 45 | 19,542 | 66 |
| Coffee | 222,583 | 15 | 48,767 | 81 | -51,363 | 23 | 2,596 | 16 |
| Copper | 194,187 | 22 | -3,714 | 40 | 879 | 60 | 2,835 | 42 |
| Brent | 169,802 | 16 | -36,098 | 51 | 34,208 | 50 | 1,890 | 35 |
| Silver | 148,294 | 15 | 17,404 | 5 | -27,990 | 94 | 10,586 | 10 |
| Platinum | 65,295 | 31 | 5,933 | 12 | -9,742 | 92 | 3,809 | 15 |
| Palladium | 7,035 | 3 | -3,461 | 2 | 3,581 | 97 | -120 | 37 |
Gold Comex Futures:
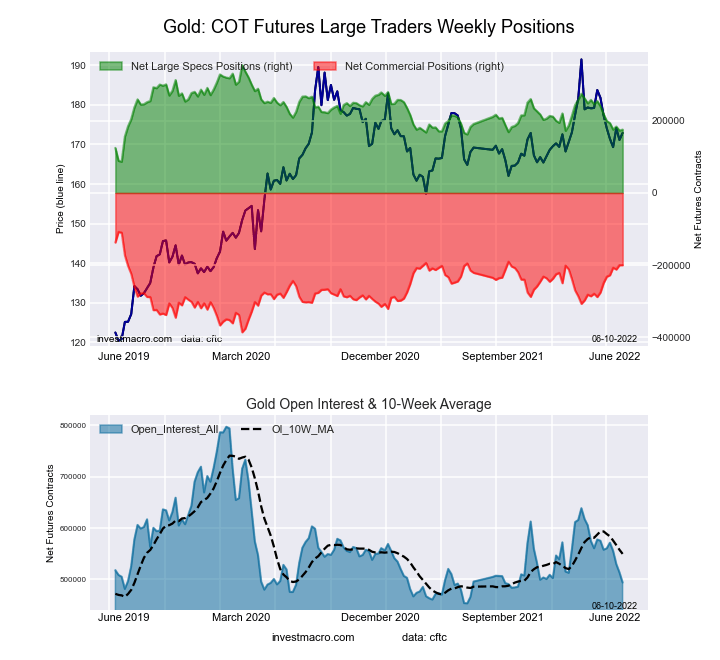
The Gold Comex Futures large speculator standing this week recorded a net position of 175,268 contracts in the data reported through Tuesday. This was a weekly increase of 2,679 contracts from the previous week which had a total of 172,589 net contracts.
This week’s current strength score (the trader positioning range over the past three years, measured from 0 to 100) shows the speculators are currently Bearish-Extreme with a score of 6.8 percent. The commercials are Bullish-Extreme with a score of 95.0 percent and the small traders (not shown in chart) are Bearish-Extreme with a score of 18.0 percent.
| Gold Futures Statistics | SPECULATORS | COMMERCIALS | SMALL TRADERS |
| – Percent of Open Interest Longs: | 54.7 | 23.7 | 8.9 |
| – Percent of Open Interest Shorts: | 19.2 | 64.1 | 3.9 |
| – Net Position: | 175,268 | -199,886 | 24,618 |
| – Gross Longs: | 270,356 | 116,965 | 44,090 |
| – Gross Shorts: | 95,088 | 316,851 | 19,472 |
| – Long to Short Ratio: | 2.8 to 1 | 0.4 to 1 | 2.3 to 1 |
| NET POSITION TREND: | |||
| – Strength Index Score (3 Year Range Pct): | 6.8 | 95.0 | 18.0 |
| – Strength Index Reading (3 Year Range): | Bearish-Extreme | Bullish-Extreme | Bearish-Extreme |
| NET POSITION MOVEMENT INDEX: | |||
| – 6-Week Change in Strength Index: | -22.3 | 25.3 | -23.5 |
Silver Comex Futures:
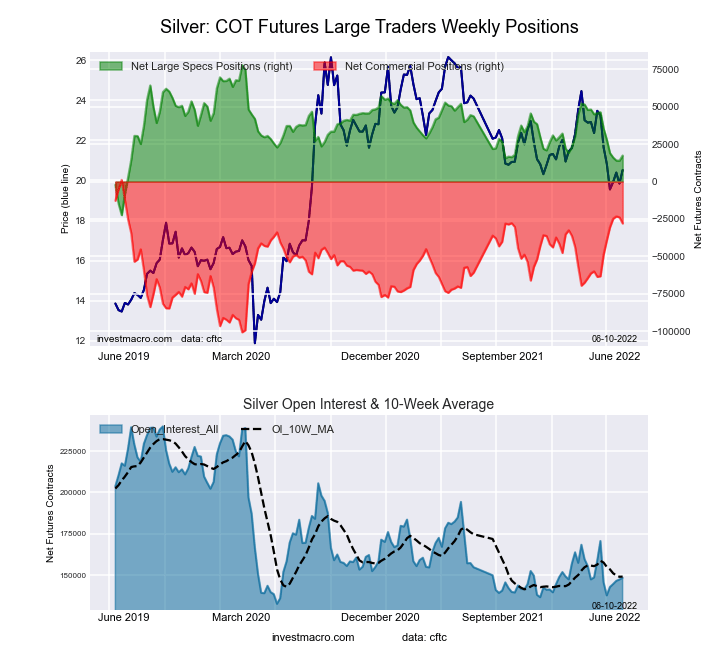
The Silver Comex Futures large speculator standing this week recorded a net position of 17,404 contracts in the data reported through Tuesday. This was a weekly rise of 3,407 contracts from the previous week which had a total of 13,997 net contracts.
This week’s current strength score (the trader positioning range over the past three years, measured from 0 to 100) shows the speculators are currently Bearish-Extreme with a score of 5.3 percent. The commercials are Bullish-Extreme with a score of 93.9 percent and the small traders (not shown in chart) are Bearish-Extreme with a score of 10.2 percent.
| Silver Futures Statistics | SPECULATORS | COMMERCIALS | SMALL TRADERS |
| – Percent of Open Interest Longs: | 37.0 | 36.9 | 16.9 |
| – Percent of Open Interest Shorts: | 25.3 | 55.8 | 9.8 |
| – Net Position: | 17,404 | -27,990 | 10,586 |
| – Gross Longs: | 54,899 | 54,707 | 25,089 |
| – Gross Shorts: | 37,495 | 82,697 | 14,503 |
| – Long to Short Ratio: | 1.5 to 1 | 0.7 to 1 | 1.7 to 1 |
| NET POSITION TREND: | |||
| – Strength Index Score (3 Year Range Pct): | 5.3 | 93.9 | 10.2 |
| – Strength Index Reading (3 Year Range): | Bearish-Extreme | Bullish-Extreme | Bearish-Extreme |
| NET POSITION MOVEMENT INDEX: | |||
| – 6-Week Change in Strength Index: | -28.2 | 26.8 | -15.3 |
Copper Grade #1 Futures:
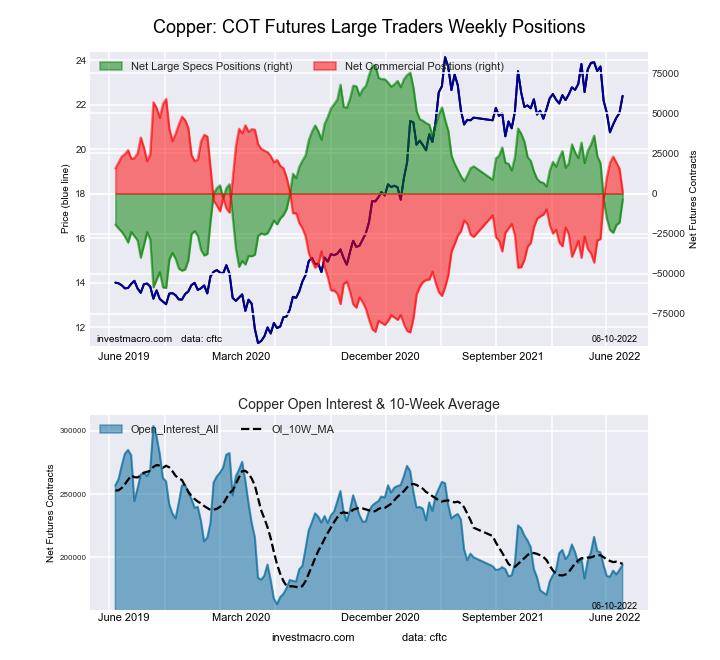
The Copper Grade #1 Futures large speculator standing this week recorded a net position of -3,714 contracts in the data reported through Tuesday. This was a weekly rise of 14,311 contracts from the previous week which had a total of -18,025 net contracts.
This week’s current strength score (the trader positioning range over the past three years, measured from 0 to 100) shows the speculators are currently Bearish with a score of 39.7 percent. The commercials are Bullish with a score of 60.1 percent and the small traders (not shown in chart) are Bearish with a score of 41.7 percent.
| Copper Futures Statistics | SPECULATORS | COMMERCIALS | SMALL TRADERS |
| – Percent of Open Interest Longs: | 30.0 | 51.7 | 8.6 |
| – Percent of Open Interest Shorts: | 31.9 | 51.3 | 7.1 |
| – Net Position: | -3,714 | 879 | 2,835 |
| – Gross Longs: | 58,232 | 100,449 | 16,646 |
| – Gross Shorts: | 61,946 | 99,570 | 13,811 |
| – Long to Short Ratio: | 0.9 to 1 | 1.0 to 1 | 1.2 to 1 |
| NET POSITION TREND: | |||
| – Strength Index Score (3 Year Range Pct): | 39.7 | 60.1 | 41.7 |
| – Strength Index Reading (3 Year Range): | Bearish | Bullish | Bearish |
| NET POSITION MOVEMENT INDEX: | |||
| – 6-Week Change in Strength Index: | 0.1 | 2.8 | -23.7 |
Platinum Futures:
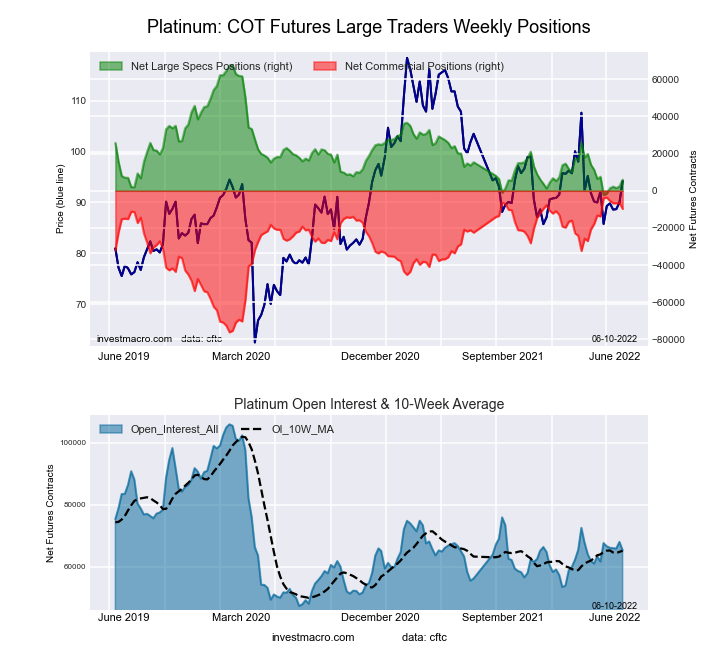
The Platinum Futures large speculator standing this week recorded a net position of 5,933 contracts in the data reported through Tuesday. This was a weekly advance of 3,570 contracts from the previous week which had a total of 2,363 net contracts.
This week’s current strength score (the trader positioning range over the past three years, measured from 0 to 100) shows the speculators are currently Bearish-Extreme with a score of 11.9 percent. The commercials are Bullish-Extreme with a score of 91.6 percent and the small traders (not shown in chart) are Bearish-Extreme with a score of 15.1 percent.
| Platinum Futures Statistics | SPECULATORS | COMMERCIALS | SMALL TRADERS |
| – Percent of Open Interest Longs: | 41.4 | 41.1 | 11.5 |
| – Percent of Open Interest Shorts: | 32.3 | 56.0 | 5.6 |
| – Net Position: | 5,933 | -9,742 | 3,809 |
| – Gross Longs: | 27,004 | 26,823 | 7,479 |
| – Gross Shorts: | 21,071 | 36,565 | 3,670 |
| – Long to Short Ratio: | 1.3 to 1 | 0.7 to 1 | 2.0 to 1 |
| NET POSITION TREND: | |||
| – Strength Index Score (3 Year Range Pct): | 11.9 | 91.6 | 15.1 |
| – Strength Index Reading (3 Year Range): | Bearish-Extreme | Bullish-Extreme | Bearish-Extreme |
| NET POSITION MOVEMENT INDEX: | |||
| – 6-Week Change in Strength Index: | 11.9 | -7.9 | -35.4 |
Palladium Futures:
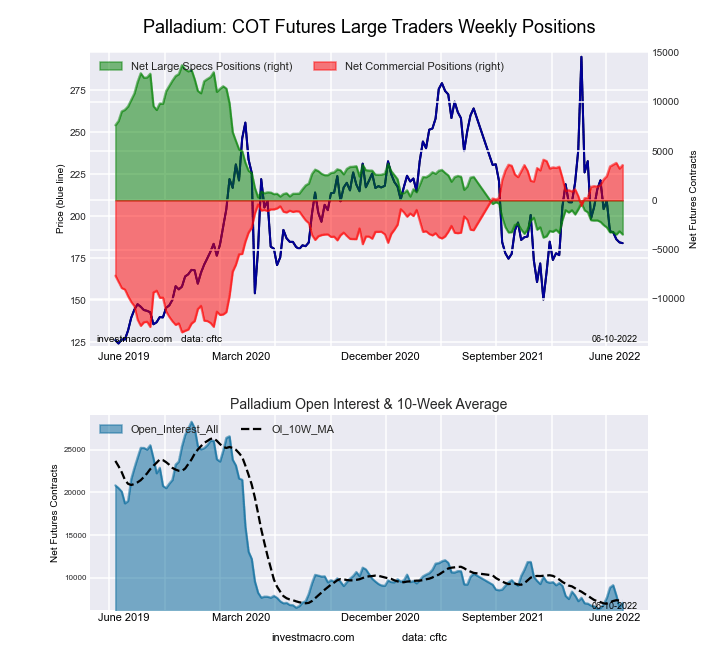
The Palladium Futures large speculator standing this week recorded a net position of -3,461 contracts in the data reported through Tuesday. This was a weekly decline of -328 contracts from the previous week which had a total of -3,133 net contracts.
This week’s current strength score (the trader positioning range over the past three years, measured from 0 to 100) shows the speculators are currently Bearish-Extreme with a score of 1.8 percent. The commercials are Bullish-Extreme with a score of 96.9 percent and the small traders (not shown in chart) are Bearish with a score of 36.9 percent.
| Palladium Futures Statistics | SPECULATORS | COMMERCIALS | SMALL TRADERS |
| – Percent of Open Interest Longs: | 13.4 | 70.9 | 15.2 |
| – Percent of Open Interest Shorts: | 62.6 | 20.0 | 16.9 |
| – Net Position: | -3,461 | 3,581 | -120 |
| – Gross Longs: | 943 | 4,985 | 1,072 |
| – Gross Shorts: | 4,404 | 1,404 | 1,192 |
| – Long to Short Ratio: | 0.2 to 1 | 3.6 to 1 | 0.9 to 1 |
| NET POSITION TREND: | |||
| – Strength Index Score (3 Year Range Pct): | 1.8 | 96.9 | 36.9 |
| – Strength Index Reading (3 Year Range): | Bearish-Extreme | Bullish-Extreme | Bearish |
| NET POSITION MOVEMENT INDEX: | |||
| – 6-Week Change in Strength Index: | -5.5 | 8.3 | -29.3 |


Comments
Log in or sign up to join the conversation.