
COT Soft Commodities Speculators Push Soybeans Bullish Bets Higher For 9th Time In 10 Weeks
Here are the latest charts and statistics for the Commitment of Traders (COT) data published by the Commodities Futures Trading Commission (CFTC). The latest COT data is updated through Tuesday, Feb. 8, 2022 and it shows a quick view of how large traders (for-profit speculators and commercial entities) were positioned in the futures markets.
Highlighting the COT soft commodities data is the continued increases in the Soybeans futures bets. The speculative net position in the Soybeans futures rose for a third consecutive week and for the ninth time out of the past ten weeks.
Over the past ten weeks, the speculative position has surged higher by a total of 154,413 net contracts and has now pushed the current net spec standing to a thirty-five week high at over +209,000 contracts.
The Soybeans positioning has reached an extreme speculator level of 82.2% in the strength index readings this week (current spec. level compared to past three years of data where above 80% is extreme bullish and below 20% is extreme bearish) for the first time since June 15 of 2021.
The soft commodities that saw higher bets this week were Soybeans (16,357 contracts), Coffee (5,489 contracts), Soybean Meal (7,421 contracts), Live Cattle (14,301 contracts), Lean Hogs (7,121 contracts), Cocoa (15,093 contracts), and Wheat (-3,928 contracts).
The soft commodities that saw lower bets this week were Corn (-35,618 contracts), Sugar (-14,503 contracts), Cotton (-1,790 contracts) and Soybean Oil (-8,375 contracts).
Data Snapshot of Commodity Market Traders | Columns Legend
| WTI Crude | 2,170,681 | 46 | 363,383 | 18 | -412,144 | 69 | 48,761 | 84 |
| Corn | 1,575,318 | 34 | 419,602 | 84 | -382,874 | 17 | -36,728 | 22 |
| Natural Gas | 1,133,934 | 6 | -115,089 | 44 | 85,151 | 58 | 29,938 | 55 |
| Sugar | 931,602 | 25 | 79,090 | 53 | -96,963 | 50 | 17,873 | 30 |
| Soybeans | 832,618 | 52 | 209,730 | 82 | -176,080 | 24 | -33,650 | 14 |
| Gold | 512,842 | 23 | 186,706 | 47 | -211,434 | 53 | 24,728 | 34 |
| Wheat | 385,172 | 26 | -3,578 | 44 | 7,972 | 49 | -4,394 | 81 |
| Heating Oil | 349,618 | 31 | 6,455 | 52 | -32,434 | 37 | 25,979 | 88 |
| Coffee | 273,102 | 39 | 66,867 | 97 | -72,255 | 3 | 5,388 | 26 |
| Brent | 208,578 | 46 | -26,323 | 73 | 22,725 | 27 | 3,598 | 58 |
| Copper | 201,860 | 28 | 18,855 | 56 | -25,523 | 42 | 6,668 | 64 |
| Silver | 147,379 | 14 | 19,299 | 42 | -32,571 | 67 | 13,272 | 20 |
| Platinum | 58,766 | 20 | 11,759 | 19 | -16,638 | 85 | 4,879 | 30 |
| Palladium | 7,497 | 5 | -1,230 | 14 | 1,035 | 83 | 195 | 56 |
Corn Futures:
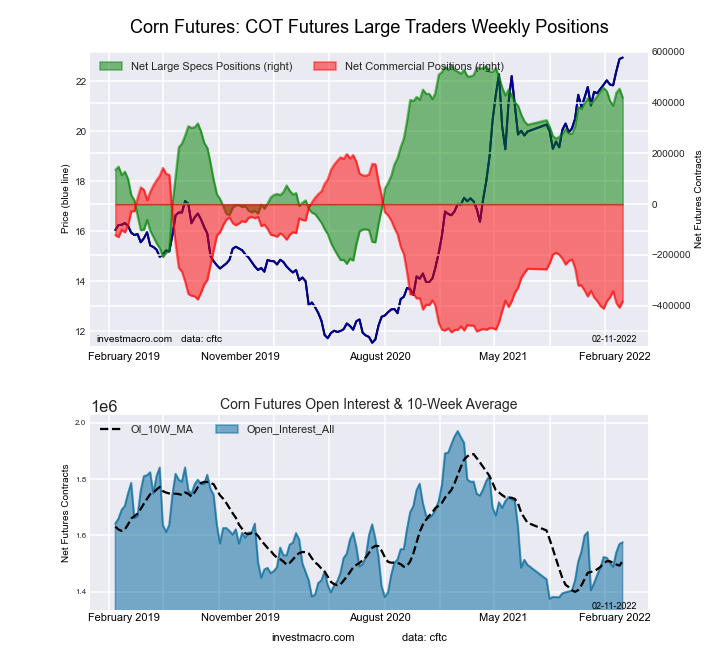
The Corn large speculator standing this week was a net position of 419,602 contracts in the data reported through Tuesday. This was a weekly decrease of -35,618 contracts from the previous week, which had a total of 455,220 net contracts.
This week’s current strength score (the trader positioning range over the past three years, measured from 0 to 100) shows the speculators are currently Bullish-Extreme with a score of 83.6%. The commercials are Bearish-Extreme with a score of 17.4% and the small traders (not shown in chart) are Bearish with a score of 21.9%.
|
CORN Futures Statistics |
SPECULATORS |
COMMERCIALS |
SMALL TRADERS |
|
–% of Open Interest Longs: |
33.0 |
44.0 |
9.4 |
|
–% of Open Interest Shorts: |
6.4 |
68.3 |
11.8 |
|
– Net Position: |
419,602 |
-382,874 |
-36,728 |
|
– Gross Longs: |
519,855 |
693,712 |
148,454 |
|
– Gross Shorts: |
100,253 |
1,076,586 |
185,182 |
|
– Long to Short Ratio: |
5.2 to 1 |
0.6 to 1 |
0.8 to 1 |
|
NET POSITION TREND: |
|
|
|
|
– Strength Index Score (3 Year Range Pct): |
83.6 |
17.4 |
21.9 |
|
– Strength Index Reading (3 Year Range): |
Bullish-Extreme |
Bearish-Extreme |
Bearish |
|
NET POSITION MOVEMENT INDEX: |
|
|
|
|
– 6-Week Change in Strength Index: |
-4.9 |
4.1 |
5.5 |
Sugar Futures:
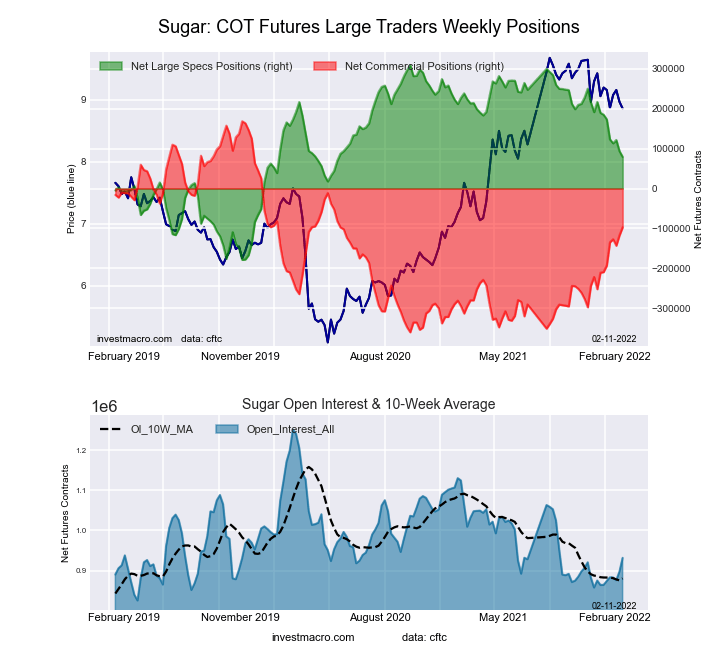
The Sugar large speculator standing this week was a net position of 79,090 contracts in the data reported through Tuesday. This was a weekly reduction of -14,503 contracts from the previous week, which had a total of 93,593 net contracts.
This week’s current strength score (the trader positioning range over the past three years, measured from 0 to 100) shows the speculators are currently Bullish with a score of 52.9%. The commercials are Bearish with a score of 49.8% and the small traders (not shown in chart) are Bearish with a score of 30.0%.
|
SUGAR Futures Statistics |
SPECULATORS |
COMMERCIALS |
SMALL TRADERS |
|
–% of Open Interest Longs: |
19.8 |
57.1 |
8.9 |
|
–% of Open Interest Shorts: |
11.3 |
67.5 |
7.0 |
|
– Net Position: |
79,090 |
-96,963 |
17,873 |
|
– Gross Longs: |
184,040 |
532,127 |
83,261 |
|
– Gross Shorts: |
104,950 |
629,090 |
65,388 |
|
– Long to Short Ratio: |
1.8 to 1 |
0.8 to 1 |
1.3 to 1 |
|
NET POSITION TREND: |
|
|
|
|
– Strength Index Score (3 Year Range Pct): |
52.9 |
49.8 |
30.0 |
|
– Strength Index Reading (3 Year Range): |
Bullish |
Bearish |
Bearish |
|
NET POSITION MOVEMENT INDEX: |
|
|
|
|
– 6-Week Change in Strength Index: |
-21.7 |
21.2 |
-8.0 |
Coffee Futures:
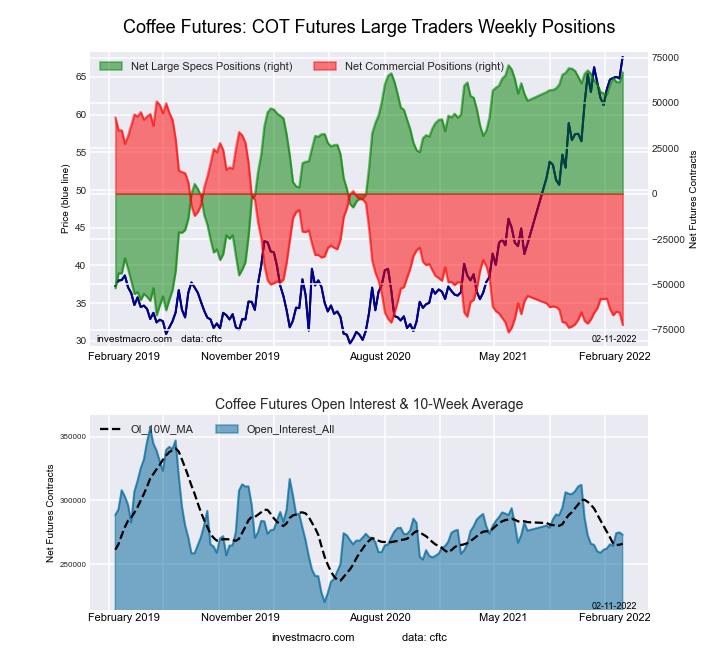
The Coffee large speculator standing this week was a net position of 66,867 contracts in the data reported through Tuesday. This was a weekly increase of 5,489 contracts from the previous week, which had a total of 61,378 net contracts.
This week’s current strength score (the trader positioning range over the past three years, measured from 0 to 100) shows the speculators are currently Bullish-Extreme with a score of 97.2%. The commercials are Bearish-Extreme with a score of 3.2% and the small traders (not shown in chart) are Bearish with a score of 25.6%.
|
COFFEE Futures Statistics |
SPECULATORS |
COMMERCIALS |
SMALL TRADERS |
|
–% of Open Interest Longs: |
29.3 |
42.3 |
4.6 |
|
–% of Open Interest Shorts: |
4.8 |
68.8 |
2.7 |
|
– Net Position: |
66,867 |
-72,255 |
5,388 |
|
– Gross Longs: |
79,999 |
115,622 |
12,695 |
|
– Gross Shorts: |
13,132 |
187,877 |
7,307 |
|
– Long to Short Ratio: |
6.1 to 1 |
0.6 to 1 |
1.7 to 1 |
|
NET POSITION TREND: |
|
|
|
|
– Strength Index Score (3 Year Range Pct): |
97.2 |
3.2 |
25.6 |
|
– Strength Index Reading (3 Year Range): |
Bullish-Extreme |
Bearish-Extreme |
Bearish |
|
NET POSITION MOVEMENT INDEX: |
|
|
|
|
– 6-Week Change in Strength Index: |
8.4 |
-11.2 |
18.3 |
Soybeans Futures:
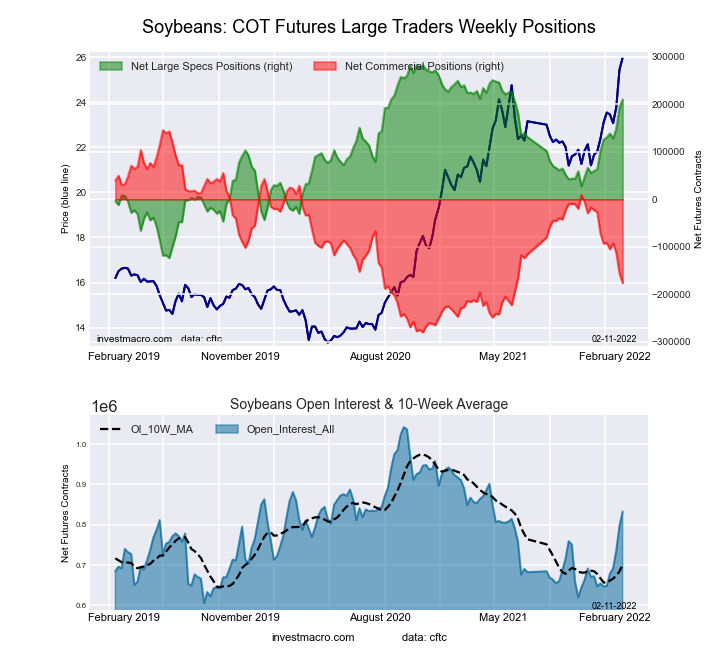
The Soybeans large speculator standing this week was a net position of 209,730 contracts in the data reported through Tuesday. This was a weekly increase of 16,357 contracts from the previous week, which had a total of 193,373 net contracts.
This week’s current strength score (the trader positioning range over the past three years, measured from 0 to 100) shows the speculators are currently Bullish-Extreme with a score of 82.2%. The commercials are Bearish with a score of 24.4% and the small traders (not shown in chart) are Bearish-Extreme with a score of 14.4%.
|
SOYBEANS Futures Statistics |
SPECULATORS |
COMMERCIALS |
SMALL TRADERS |
|
–% of Open Interest Longs: |
30.7 |
45.5 |
6.7 |
|
–% of Open Interest Shorts: |
5.5 |
66.6 |
10.7 |
|
– Net Position: |
209,730 |
-176,080 |
-33,650 |
|
– Gross Longs: |
255,224 |
378,830 |
55,648 |
|
– Gross Shorts: |
45,494 |
554,910 |
89,298 |
|
– Long to Short Ratio: |
5.6 to 1 |
0.7 to 1 |
0.6 to 1 |
|
NET POSITION TREND: |
|
|
|
|
– Strength Index Score (3 Year Range Pct): |
82.2 |
24.4 |
14.4 |
|
– Strength Index Reading (3 Year Range): |
Bullish-Extreme |
Bearish |
Bearish-Extreme |
|
NET POSITION MOVEMENT INDEX: |
|
|
|
|
– 6-Week Change in Strength Index: |
20.8 |
-19.5 |
-2.4 |
Soybean Oil Futures:
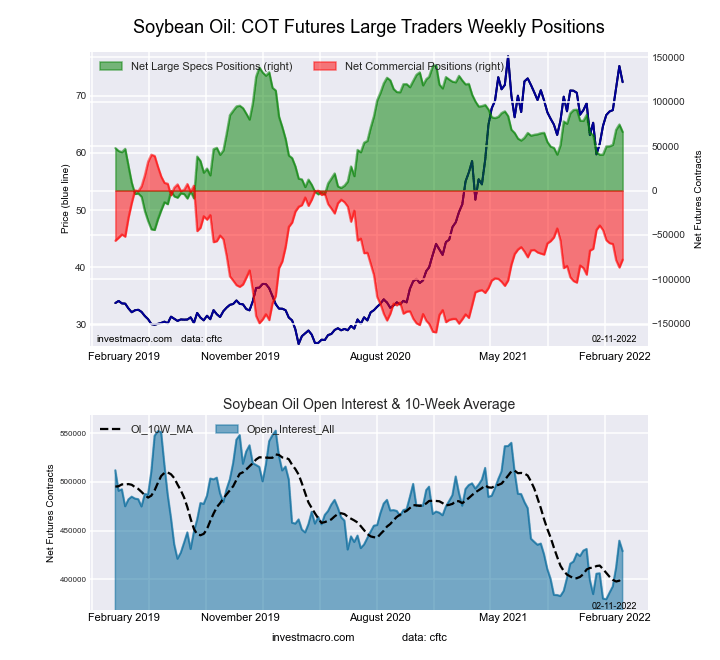
The Soybean Oil large speculator standing this week was a net position of 66,035 contracts in the data reported through Tuesday. This was a weekly reduction of -8,375 contracts from the previous week, which had a total of 74,410 net contracts.
This week’s current strength score (the trader positioning range over the past three years, measured from 0 to 100) shows the speculators are currently Bullish with a score of 59.5%. The commercials are Bearish with a score of 40.9% and the small traders (not shown in chart) are Bullish with a score of 57.2%.
|
SOYBEAN OIL Futures Statistics |
SPECULATORS |
COMMERCIALS |
SMALL TRADERS |
|
–% of Open Interest Longs: |
25.2 |
47.7 |
8.6 |
|
–% of Open Interest Shorts: |
9.8 |
65.8 |
5.9 |
|
– Net Position: |
66,035 |
-77,767 |
11,732 |
|
– Gross Longs: |
107,923 |
204,514 |
36,975 |
|
– Gross Shorts: |
41,888 |
282,281 |
25,243 |
|
– Long to Short Ratio: |
2.6 to 1 |
0.7 to 1 |
1.5 to 1 |
|
NET POSITION TREND: |
|
|
|
|
– Strength Index Score (3 Year Range Pct): |
59.5 |
40.9 |
57.2 |
|
– Strength Index Reading (3 Year Range): |
Bullish |
Bearish |
Bullish |
|
NET POSITION MOVEMENT INDEX: |
|
|
|
|
– 6-Week Change in Strength Index: |
13.7 |
-16.6 |
29.2 |
Soybean Meal Futures:
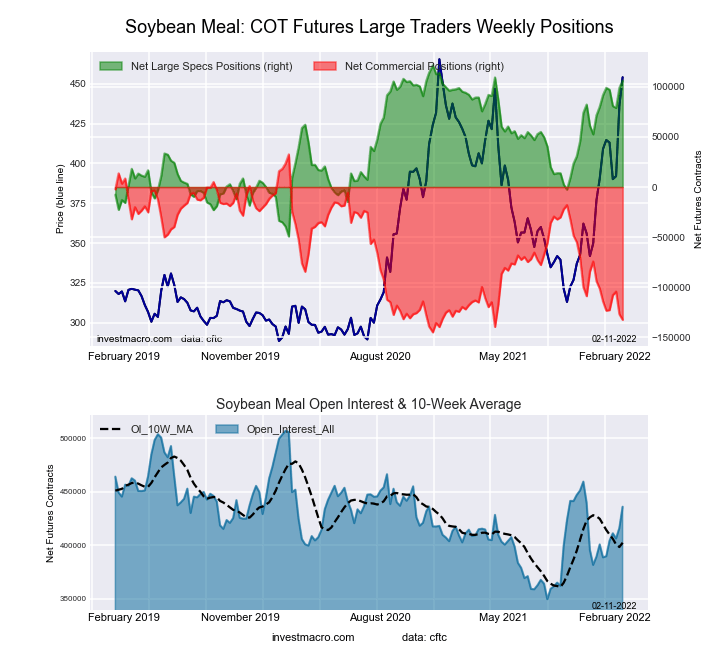
The Soybean Meal large speculator standing this week was a net position of 106,260 contracts in the data reported through Tuesday. This was a weekly rise of 7,421 contracts from the previous week, which had a total of 98,839 net contracts.
This week’s current strength score (the trader positioning range over the past three years, measured from 0 to 100) shows the speculators are currently Bullish-Extreme with a score of 91.0%. The commercials are Bearish-Extreme with a score of 7.0% and the small traders (not shown in chart) are Bullish with a score of 76.0%.
|
SOYBEAN MEAL Futures Statistics |
SPECULATORS |
COMMERCIALS |
SMALL TRADERS |
|
–% of Open Interest Longs: |
29.4 |
43.0 |
11.0 |
|
–% of Open Interest Shorts: |
5.1 |
73.4 |
5.0 |
|
– Net Position: |
106,260 |
-132,541 |
26,281 |
|
– Gross Longs: |
128,328 |
187,284 |
48,040 |
|
– Gross Shorts: |
22,068 |
319,825 |
21,759 |
|
– Long to Short Ratio: |
5.8 to 1 |
0.6 to 1 |
2.2 to 1 |
|
NET POSITION TREND: |
|
|
|
|
– Strength Index Score (3 Year Range Pct): |
91.0 |
7.0 |
76.0 |
|
– Strength Index Reading (3 Year Range): |
Bullish-Extreme |
Bearish-Extreme |
Bullish |
|
NET POSITION MOVEMENT INDEX: |
|
|
|
|
– 6-Week Change in Strength Index: |
8.5 |
-10.4 |
15.6 |
Live Cattle Futures:
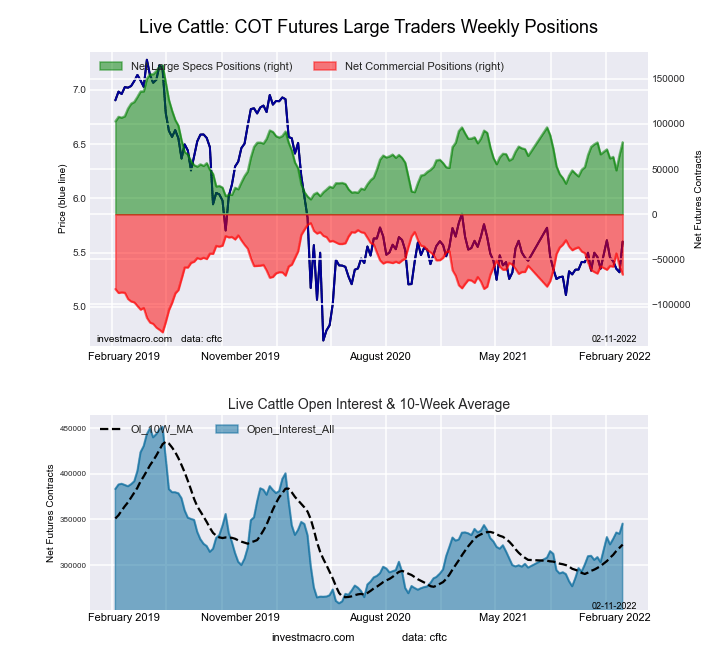
The Live Cattle large speculator standing this week was a net position of 79,809 contracts in the data reported through Tuesday. This was a weekly gain of 14,301 contracts from the previous week, which had a total of 65,508 net contracts.
This week’s current strength score (the trader positioning range over the past three years, measured from 0 to 100) shows the speculators are currently Bearish with a score of 42.6%. The commercials are Bullish with a score of 52.8% and the small traders (not shown in chart) are Bullish with a score of 55.7%.
|
LIVE CATTLE Futures Statistics |
SPECULATORS |
COMMERCIALS |
SMALL TRADERS |
|
–% of Open Interest Longs: |
37.5 |
36.9 |
9.9 |
|
–% of Open Interest Shorts: |
14.4 |
56.2 |
13.7 |
|
– Net Position: |
79,809 |
-66,920 |
-12,889 |
|
– Gross Longs: |
129,605 |
127,373 |
34,272 |
|
– Gross Shorts: |
49,796 |
194,293 |
47,161 |
|
– Long to Short Ratio: |
2.6 to 1 |
0.7 to 1 |
0.7 to 1 |
|
NET POSITION TREND: |
|
|
|
|
– Strength Index Score (3 Year Range Pct): |
42.6 |
52.8 |
55.7 |
|
– Strength Index Reading (3 Year Range): |
Bearish |
Bullish |
Bullish |
|
NET POSITION MOVEMENT INDEX: |
|
|
|
|
– 6-Week Change in Strength Index: |
9.6 |
-7.6 |
-12.2 |
Lean Hogs Futures:
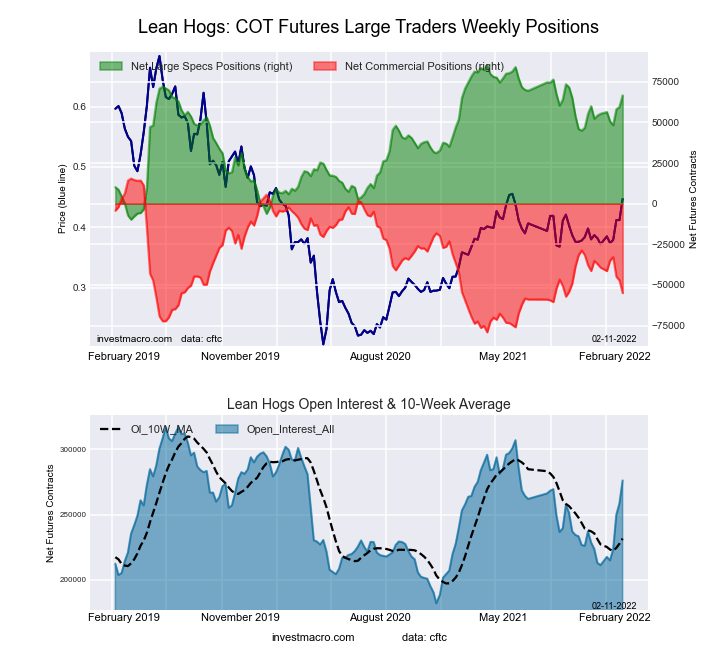
The Lean Hogs large speculator standing this week was a net position of 66,642 contracts in the data reported through Tuesday. This was a weekly increase of 7,121 contracts from the previous week, which had a total of 59,521 net contracts.
This week’s current strength score (the trader positioning range over the past three years, measured from 0 to 100) shows the speculators are currently Bullish with a score of 79.7%. The commercials are Bearish with a score of 25.8% and the small traders (not shown in chart) are Bearish with a score of 29.7%.
|
LEAN HOGS Futures Statistics |
SPECULATORS |
COMMERCIALS |
SMALL TRADERS |
|
–% of Open Interest Longs: |
41.3 |
31.9 |
8.2 |
|
–% of Open Interest Shorts: |
17.2 |
51.8 |
12.4 |
|
– Net Position: |
66,642 |
-54,973 |
-11,669 |
|
– Gross Longs: |
114,130 |
88,056 |
22,616 |
|
– Gross Shorts: |
47,488 |
143,029 |
34,285 |
|
– Long to Short Ratio: |
2.4 to 1 |
0.6 to 1 |
0.7 to 1 |
|
NET POSITION TREND: |
|
|
|
|
– Strength Index Score (3 Year Range Pct): |
79.7 |
25.8 |
29.7 |
|
– Strength Index Reading (3 Year Range): |
Bullish |
Bearish |
Bearish |
|
NET POSITION MOVEMENT INDEX: |
|
|
|
|
– 6-Week Change in Strength Index: |
9.5 |
-13.3 |
15.1 |
Cotton Futures:
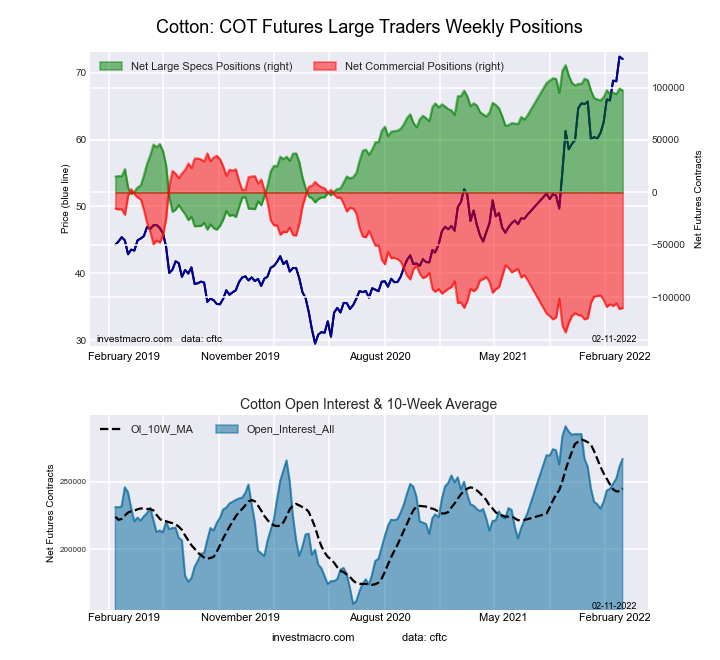
The Cotton large speculator standing this week was a net position of 97,210 contracts in the data reported through Tuesday. This was a weekly decline of -1,790 contracts from the previous week, which had a total of 99,000 net contracts.
This week’s current strength score (the trader positioning range over the past three years, measured from 0 to 100) shows the speculators are currently Bullish-Extreme with a score of 84.6%. The commercials are Bearish-Extreme with a score of 13.6% and the small traders (not shown in chart) are Bullish-Extreme with a score of 94.1%.
|
COTTON Futures Statistics |
SPECULATORS |
COMMERCIALS |
SMALL TRADERS |
|
–% of Open Interest Longs: |
42.1 |
36.5 |
7.8 |
|
–% of Open Interest Shorts: |
5.7 |
77.8 |
3.0 |
|
– Net Position: |
97,210 |
-110,111 |
12,901 |
|
– Gross Longs: |
112,341 |
97,445 |
20,934 |
|
– Gross Shorts: |
15,131 |
207,556 |
8,033 |
|
– Long to Short Ratio: |
7.4 to 1 |
0.5 to 1 |
2.6 to 1 |
|
NET POSITION TREND: |
|
|
|
|
– Strength Index Score (3 Year Range Pct): |
84.6 |
13.6 |
94.1 |
|
– Strength Index Reading (3 Year Range): |
Bullish-Extreme |
Bearish-Extreme |
Bullish-Extreme |
|
NET POSITION MOVEMENT INDEX: |
|
|
|
|
– 6-Week Change in Strength Index: |
4.0 |
-4.5 |
8.0 |
Cocoa Futures:
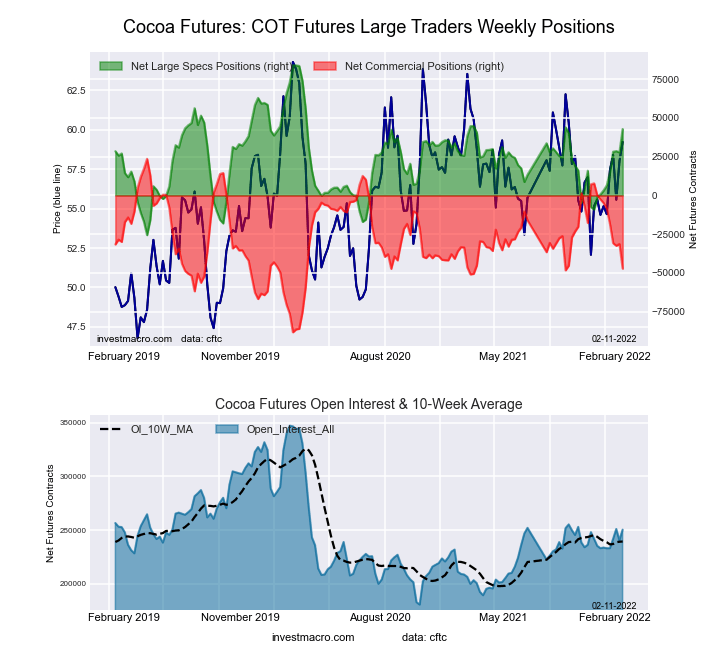
The Cocoa large speculator standing this week was a net position of 42,855 contracts in the data reported through Tuesday. This was a weekly rise of 15,093 contracts from the previous week, which had a total of 27,762 net contracts.
This week’s current strength score (the trader positioning range over the past three years, measured from 0 to 100) shows the speculators are currently Bullish with a score of 62.4%. The commercials are Bearish with a score of 36.7% and the small traders (not shown in chart) are Bullish with a score of 58.3%.
|
COCOA Futures Statistics |
SPECULATORS |
COMMERCIALS |
SMALL TRADERS |
|
–% of Open Interest Longs: |
31.4 |
43.7 |
5.0 |
|
–% of Open Interest Shorts: |
14.3 |
62.6 |
3.2 |
|
– Net Position: |
42,855 |
-47,234 |
4,379 |
|
– Gross Longs: |
78,615 |
109,531 |
12,487 |
|
– Gross Shorts: |
35,760 |
156,765 |
8,108 |
|
– Long to Short Ratio: |
2.2 to 1 |
0.7 to 1 |
1.5 to 1 |
|
NET POSITION TREND: |
|
|
|
|
– Strength Index Score (3 Year Range Pct): |
62.4 |
36.7 |
58.3 |
|
– Strength Index Reading (3 Year Range): |
Bullish |
Bearish |
Bullish |
|
NET POSITION MOVEMENT INDEX: |
|
|
|
|
– 6-Week Change in Strength Index: |
36.1 |
-37.8 |
31.2 |
Wheat Futures:
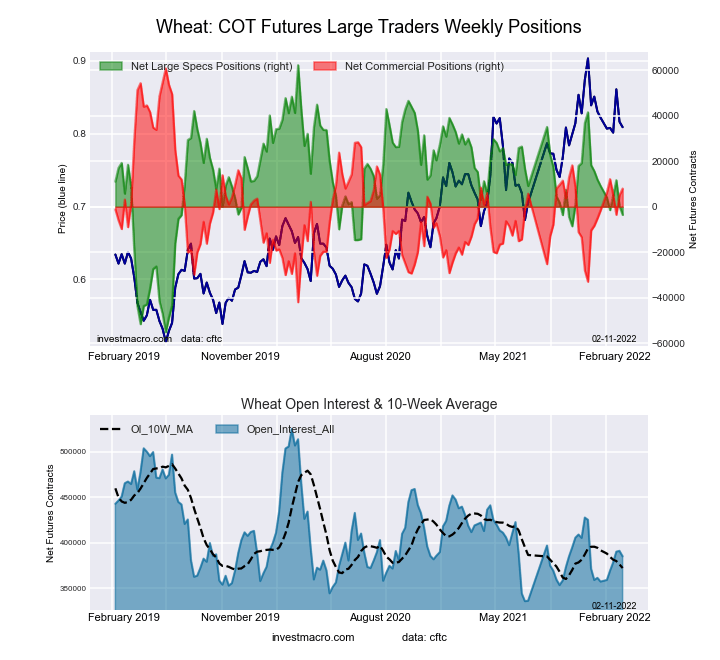
The Wheat large speculator standing this week was a net position of -3,578 contracts in the data reported through Tuesday. This was a weekly decrease of -3,928 contracts from the previous week, which had a total of 350 net contracts.
This week’s current strength score (the trader positioning range over the past three years, measured from 0 to 100) shows the speculators are currently Bearish with a score of 44.0%. The commercials are Bearish with a score of 48.6% and the small traders (not shown in chart) are Bullish-Extreme with a score of 80.6%.
|
WHEAT Futures Statistics |
SPECULATORS |
COMMERCIALS |
SMALL TRADERS |
|
–% of Open Interest Longs: |
27.0 |
39.5 |
9.5 |
|
–% of Open Interest Shorts: |
27.9 |
37.4 |
10.6 |
|
– Net Position: |
-3,578 |
7,972 |
-4,394 |
|
– Gross Longs: |
103,885 |
152,212 |
36,456 |
|
– Gross Shorts: |
107,463 |
144,240 |
40,850 |
|
– Long to Short Ratio: |
1.0 to 1 |
1.1 to 1 |
0.9 to 1 |
|
NET POSITION TREND: |
|
|
|
|
– Strength Index Score (3 Year Range Pct): |
44.0 |
48.6 |
80.6 |
|
– Strength Index Reading (3 Year Range): |
Bearish |
Bearish |
Bullish-Extreme |
|
NET POSITION MOVEMENT INDEX: |
|
|
|
|
– 6-Week Change in Strength Index: |
-8.1 |
6.2 |
14.8 |
Article By InvestMacro – Receive our weekly COT Reports by Email
* more


