

Image Source: Unsplash
Here are the latest charts and statistics for the Commitment of Traders (COT) data published by the Commodities Futures Trading Commission (CFTC). The latest COT data is updated through Tuesday, Aug. 16, and it shows a quick view of how large traders (for-profit speculators and commercial entities) were positioned in the futures markets.
Weekly Speculator Changes Week 33: Platinum Bullish Bets Rise
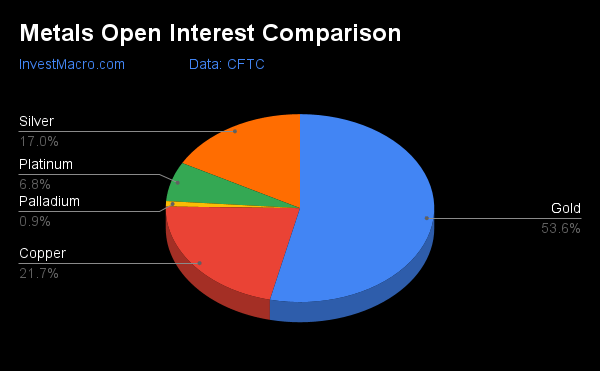
COT precious metals speculator bets were overall higher this week, as four out of the five metals markets we cover had higher positioning this week. Only one market had a lower number of contracts.
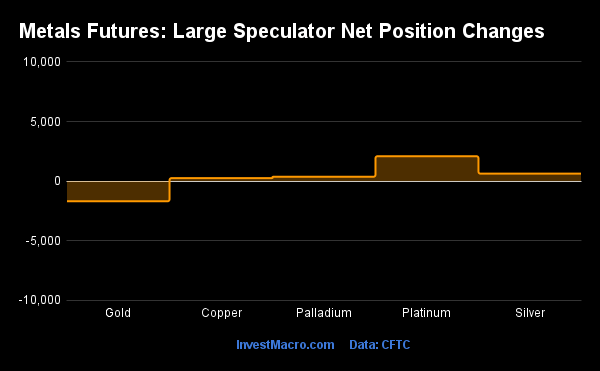
Leading the gains for the precious metals markets was platinum (2,094 contracts) with silver (629 contracts), palladium (371 contracts), and copper (257 contracts) also experiencing a positive week. The metals market leading the declines in speculator bets this week was gold (-1,687 contracts).
Highlighting the metals data this week is that platinum speculator bets that have bounced back a bit over the past three weeks after a recent down-streak that put the position in negative territory. The platinum large speculator positions rose this week for a third straight week and for the fourth time over the past five weeks.
This recent uptick has pulled the overall position out of a bearish level that had held from June 28 to Aug. 2. This week, the current position increased into a small bullish level of +2,940 contracts. The platinum futures price, meanwhile, took a step back this week with a loss. The futures had previously seen four straight weekly gains before closing the week below the $900.00 level.
Data Snapshot of Commodity Market Traders | Columns Legend
| WTI Crude | 1,557,349 | 0 | 214,940 | 1 | -239,291 | 100 | 24,351 | 48 |
| Corn | 1,316,462 | 1 | 220,129 | 58 | -166,318 | 48 | -53,811 | 12 |
| Natural Gas | 983,460 | 5 | -120,911 | 42 | 82,862 | 57 | 38,049 | 70 |
| Sugar | 737,535 | 7 | 49,970 | 47 | -61,837 | 56 | 11,867 | 23 |
| Soybeans | 595,095 | 5 | 83,183 | 39 | -51,650 | 68 | -31,533 | 18 |
| Gold | 453,960 | 0 | 141,164 | 19 | -153,709 | 84 | 12,545 | 4 |
| Wheat | 313,237 | 11 | -1,908 | 17 | 7,448 | 70 | -5,540 | 82 |
| Heating Oil | 296,987 | 34 | 24,926 | 79 | -40,022 | 29 | 15,096 | 51 |
| Coffee | 190,302 | 0 | 33,471 | 68 | -35,318 | 37 | 1,847 | 16 |
| Copper | 183,500 | 17 | -28,220 | 22 | 28,932 | 79 | -712 | 21 |
| Brent | 176,902 | 21 | -36,012 | 51 | 34,290 | 50 | 1,722 | 33 |
| Silver | 144,314 | 11 | 3,508 | 10 | -12,451 | 90 | 8,943 | 12 |
| Platinum | 57,254 | 17 | 2,940 | 12 | -6,361 | 90 | 3,421 | 10 |
| Palladium | 7,951 | 7 | -1,599 | 14 | 1,536 | 83 | 63 | 48 |
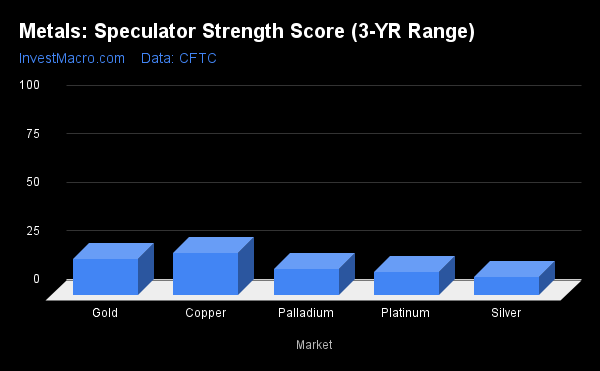
Strength Scores
Strength scores (a measure of the three-year range of speculator positions, from 0 to 100 where above 80 is extreme bullish and below 20 is extreme bearish) showed that copper is the highest metals market, currently at just 22.0% of its three-year range.
The rest of the metals markets are all in bearish extreme levels (below 20%) and have been for a while now. Gold (18.6%), palladium (13.8%), platinum (12.0%), and silver (9.7%) round out the rest of the metals market in strength scores.
- Gold (18.6%) vs. gold the previous week (19.2%).
- Silver (9.7%) vs. silver the previous week (9.0%).
- Copper (22.0%) vs. copper the previous week (21.9%).
- Platinum (12.0%) vs. platinum the previous week (9.2%).
- Palladium (13.8%) vs. palladium the previous week (11.7%).
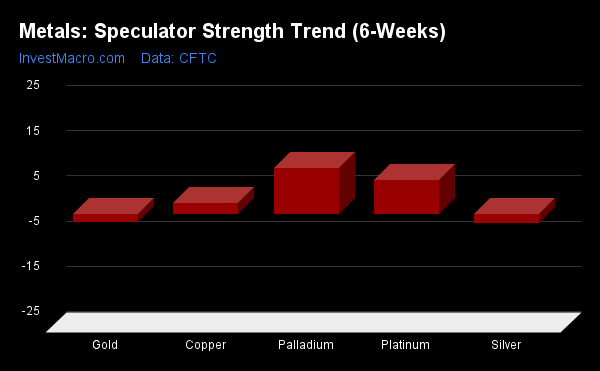
Strength Trends
Strength Score Trends (or the move index, which calculates the six-week changes in strength scores) show that palladium (10.2%) leads the trend for metals this week. Platinum (7.7%) and copper (2.6%) are the only other positive movers in the latest trends data. Silver (-2.0%) and gold (-1.7%) lead the downside trend scores currently, but they have both improved since last week.
- Gold (-1.7%) vs. gold the previous week (-5.7%).
- Silver (-2.0%) vs. silver the previous week (-9.7%).
- Copper (2.6%) vs. copper the previous week (1.6%).
- Platinum (7.7%) vs. platinum the previous week (2.9%).
- Palladium (10.2%) vs. palladium the previous week (10.4%).
Individual Markets - Gold Comex Futures
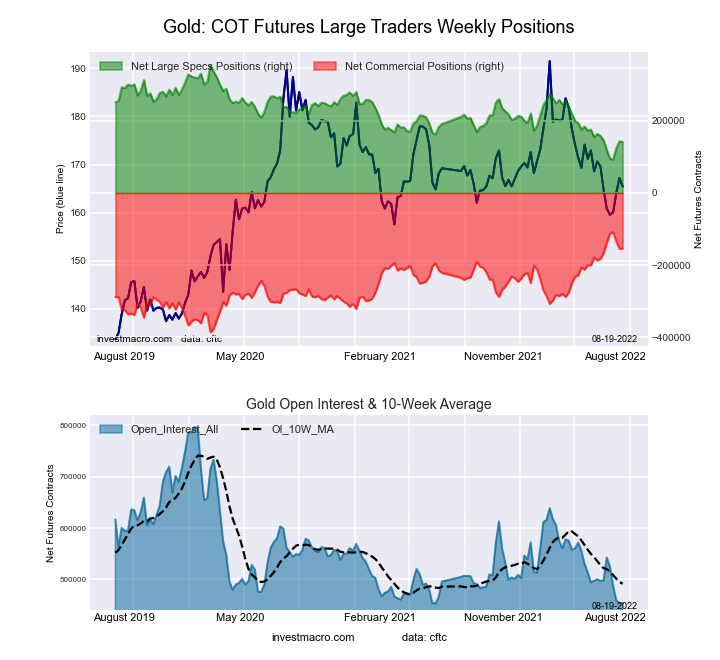
The gold Comex futures large speculator standing this week reached a net position of 141,164 contracts in the data reported through Tuesday. This was a weekly fall of -1,687 contracts from the previous week, which had a total of 142,851 net contracts.
This week’s current strength score (the trader positioning range over the past three years, measured from 0 to 100) shows the speculators are currently Bearish-Extreme with a score of 18.6%. The commercials are Bullish-Extreme with a score of 83.7%, and the small traders (not shown in chart) are Bearish-Extreme with a score of 3.6%.
| Gold Futures Statistics | SPECULATORS | COMMERCIALS | SMALL TRADERS |
| –% of Open Interest Longs: | 52.5 | 27.0 | 8.3 |
| –% of Open Interest Shorts: | 21.4 | 60.9 | 5.6 |
| – Net Position: | 141,164 | -153,709 | 12,545 |
| – Gross Longs: | 238,196 | 122,566 | 37,826 |
| – Gross Shorts: | 97,032 | 276,275 | 25,281 |
| – Long to Short Ratio: | 2.5 to 1 | 0.4 to 1 | 1.5 to 1 |
| NET POSITION TREND: | |||
| – Strength Index Score (3 Year Range Pct): | 18.6 | 83.7 | 3.6 |
| – Strength Index Reading (3 Year Range): | Bearish-Extreme | Bullish-Extreme | Bearish-Extreme |
| NET POSITION MOVEMENT INDEX: | |||
| – 6-Week Change in Strength Index: | -1.7 | 4.3 | -20.2 |
Silver Comex Futures
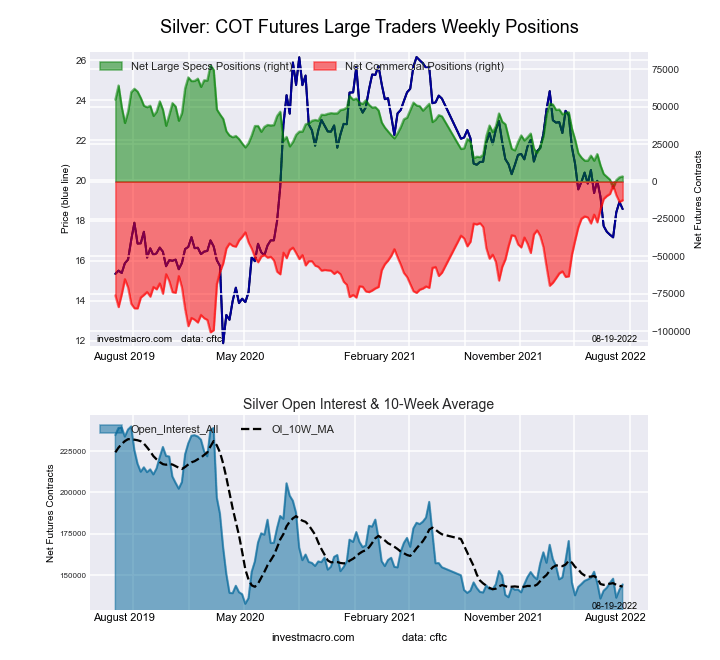
The silver Comex futures large speculator standing this week reached a net position of 3,508 contracts in the data reported through Tuesday. This was a weekly rise of 629 contracts from the previous week, which had a total of 2,879 net contracts.
This week’s current strength score (the trader positioning range over the past three years, measured from 0 to 100) shows the speculators are currently Bearish-Extreme with a score of 9.7%. The commercials are Bullish-Extreme with a score of 90.0%, and the small traders (not shown in chart) are Bearish-Extreme with a score of 12.3%.
| Silver Futures Statistics | SPECULATORS | COMMERCIALS | SMALL TRADERS |
| –% of Open Interest Longs: | 33.2 | 41.4 | 16.1 |
| –% of Open Interest Shorts: | 30.7 | 50.0 | 9.9 |
| – Net Position: | 3,508 | -12,451 | 8,943 |
| – Gross Longs: | 47,851 | 59,753 | 23,230 |
| – Gross Shorts: | 44,343 | 72,204 | 14,287 |
| – Long to Short Ratio: | 1.1 to 1 | 0.8 to 1 | 1.6 to 1 |
| NET POSITION TREND: | |||
| – Strength Index Score (3 Year Range Pct): | 9.7 | 90.0 | 12.3 |
| – Strength Index Reading (3 Year Range): | Bearish-Extreme | Bullish-Extreme | Bearish-Extreme |
| NET POSITION MOVEMENT INDEX: | |||
| – 6-Week Change in Strength Index: | -2.0 | -0.8 | 12.0 |
Copper Grade #1 Futures
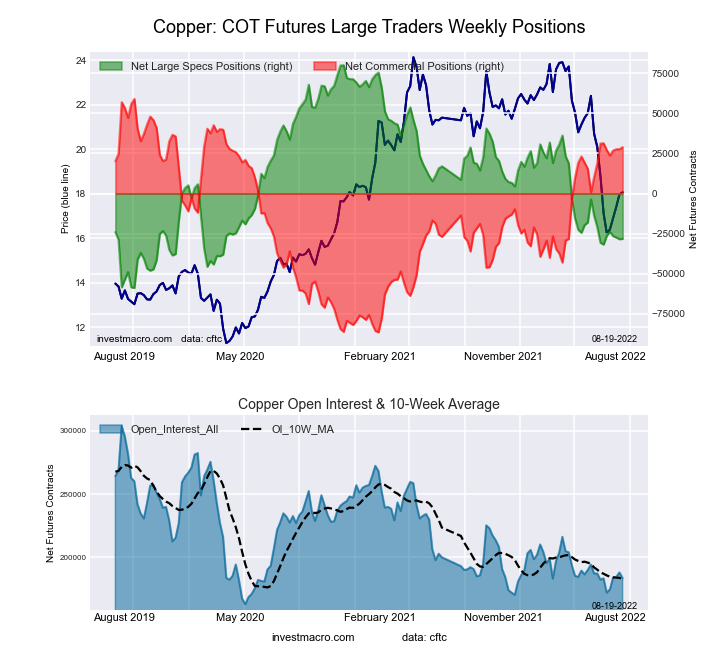
The copper Grade #1 futures large speculator standing this week reached a net position of -28,220 contracts in the data reported through Tuesday. This was a weekly rise of 257 contracts from the previous week, which had a total of -28,477 net contracts.
This week’s current strength score (the trader positioning range over the past three years, measured from 0 to 100) shows the speculators are currently Bearish with a score of 22.0%. The commercials are Bullish with a score of 79.3%, and the small traders (not shown in chart) are Bearish with a score of 21.2%.
| Copper Futures Statistics | SPECULATORS | COMMERCIALS | SMALL TRADERS |
| –% of Open Interest Longs: | 25.5 | 46.4 | 7.7 |
| –% of Open Interest Shorts: | 40.9 | 30.7 | 8.1 |
| – Net Position: | -28,220 | 28,932 | -712 |
| – Gross Longs: | 46,797 | 85,187 | 14,097 |
| – Gross Shorts: | 75,017 | 56,255 | 14,809 |
| – Long to Short Ratio: | 0.6 to 1 | 1.5 to 1 | 1.0 to 1 |
| NET POSITION TREND: | |||
| – Strength Index Score (3 Year Range Pct): | 22.0 | 79.3 | 21.2 |
| – Strength Index Reading (3 Year Range): | Bearish | Bullish | Bearish |
| NET POSITION MOVEMENT INDEX: | |||
| – 6-Week Change in Strength Index: | 2.6 | -1.7 | -6.8 |
Platinum Futures
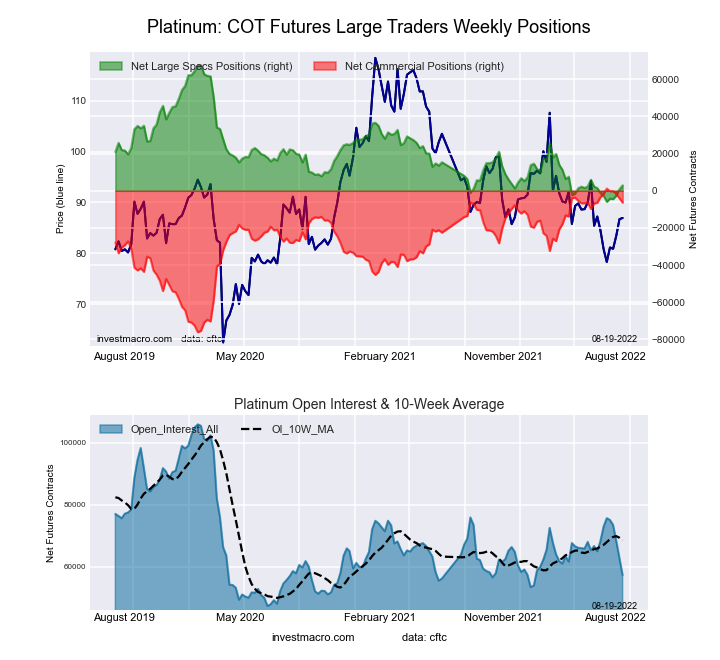
The platinum futures large speculator standing this week reached a net position of 2,940 contracts in the data reported through Tuesday. This was a weekly lift of 2,094 contracts from the previous week, which had a total of 846 net contracts.
This week’s current strength score (the trader positioning range over the past three years, measured from 0 to 100) shows the speculators are currently Bearish-Extreme with a score of 12.0%. The commercials are Bullish-Extreme with a score of 90.2%, and the small traders (not shown in chart) are Bearish-Extreme with a score of 9.6%.
| Platinum Futures Statistics | SPECULATORS | COMMERCIALS | SMALL TRADERS |
| –% of Open Interest Longs: | 45.8 | 39.7 | 11.3 |
| –% of Open Interest Shorts: | 40.7 | 50.8 | 5.3 |
| – Net Position: | 2,940 | -6,361 | 3,421 |
| – Gross Longs: | 26,218 | 22,749 | 6,467 |
| – Gross Shorts: | 23,278 | 29,110 | 3,046 |
| – Long to Short Ratio: | 1.1 to 1 | 0.8 to 1 | 2.1 to 1 |
| NET POSITION TREND: | |||
| – Strength Index Score (3 Year Range Pct): | 12.0 | 90.2 | 9.6 |
| – Strength Index Reading (3 Year Range): | Bearish-Extreme | Bullish-Extreme | Bearish-Extreme |
| NET POSITION MOVEMENT INDEX: | |||
| – 6-Week Change in Strength Index: | 7.7 | -6.1 | -13.7 |
Palladium Futures
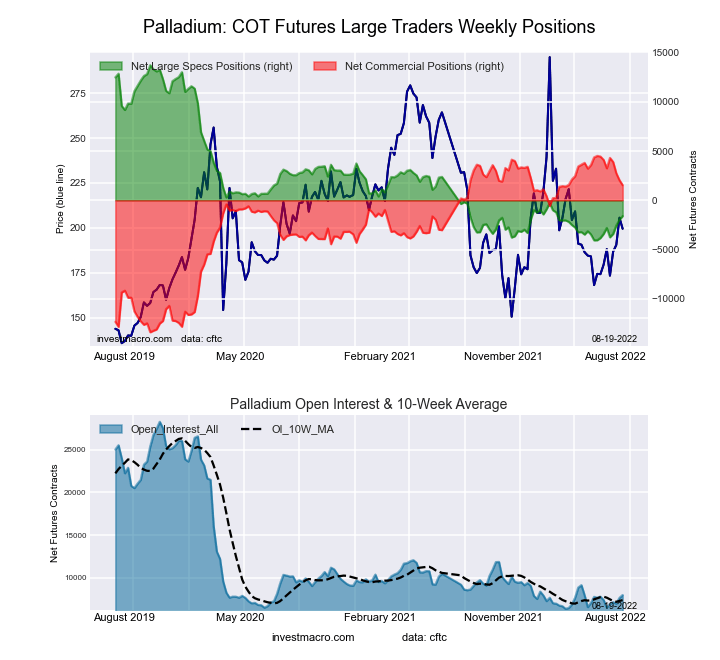
The palladium futures large speculator standing this week reached a net position of -1,599 contracts in the data reported through Tuesday. This was a weekly advance of 371 contracts from the previous week, which had a total of -1,970 net contracts.
This week’s current strength score (the trader positioning range over the past three years, measured from 0 to 100) shows the speculators are currently Bearish-Extreme with a score of 13.8%. The commercials are Bullish-Extreme with a score of 83.4%, and the small traders (not shown in chart) are Bearish with a score of 47.5%.
| Palladium Futures Statistics | SPECULATORS | COMMERCIALS | SMALL TRADERS |
| –% of Open Interest Longs: | 18.6 | 54.9 | 15.1 |
| –% of Open Interest Shorts: | 38.7 | 35.6 | 14.3 |
| – Net Position: | -1,599 | 1,536 | 63 |
| – Gross Longs: | 1,479 | 4,363 | 1,202 |
| – Gross Shorts: | 3,078 | 2,827 | 1,139 |
| – Long to Short Ratio: | 0.5 to 1 | 1.5 to 1 | 1.1 to 1 |
| NET POSITION TREND: | |||
| – Strength Index Score (3 Year Range Pct): | 13.8 | 83.4 | 47.5 |
| – Strength Index Reading (3 Year Range): | Bearish-Extreme | Bullish-Extreme | Bearish |
| NET POSITION MOVEMENT INDEX: | |||
| – 6-Week Change in Strength Index: | 10.2 | -14.3 | 43.8 |
Article By InvestMacro – Receive our weekly COT Reports by Email
*COT Report: The COT data, released weekly to the public each Friday, is updated through the most recent Tuesday (data is three days old) and shows a quick view of how large speculators or non-commercials (for-profit traders) were positioned in the futures markets.
The CFTC categorizes trader positions according to commercial hedgers (traders who use futures contracts for hedging as part of the business), non-commercials (large traders who speculate to realize trading profits), and nonreportable traders (usually small traders/speculators), as well as their open interest (contracts open in the market at time of reporting). See CFTC criteria here.
More By This Author:
Gold & Silver Large Speculator Bets Continue To Gain After Falling To Multi-Year Lows
Currency Speculators Further Pared Back On Japanese Yen & British Pound Bearish Bets
Soft Commodities Speculator Bets Go Slightly Higher Led By Live Cattle & Lean Hogs


Comments
Log in or sign up to join the conversation.