
Here are the latest charts and statistics for the Commitment of Traders (COT) data published by the Commodities Futures Trading Commission (CFTC).
The latest COT data is updated through Tuesday, February 8th, 2022 and shows a quick view of how large traders (for-profit speculators and commercial entities) were positioned in the futures markets.
Highlighting the COT metals data is the recent uptrend in the Copper futures bets. The speculative net position in the Copper futures has risen for three out of the past four weeks and in five out of the past seven weeks. Copper bets had been in a very strong and rising bullish position throughout the second half of 2020 and maintained their bullishness in 2021 but to a lesser degree. The bullish bets started to falter recently in December and dropped to an eighty-one week low on December 21st at a bullish position of just +4,437 contracts. Since then, speculator’s Copper bets have started to trend higher and this week hold a position of +18,855 net contracts.
The metals this week with higher speculator bets were Gold (14,564 contracts) and Copper (2,700 contracts) while the markets with lower speculator contracts were Silver (-2,819 contracts), Platinum (-2,822 contracts) and Palladium (-238 contracts).
Data Snapshot of Commodity Market Traders | Columns Legend
| WTI Crude | 2,170,681 | 46 | 363,383 | 18 | -412,144 | 69 | 48,761 | 84 |
| Corn | 1,575,318 | 34 | 419,602 | 84 | -382,874 | 17 | -36,728 | 22 |
| Natural Gas | 1,133,934 | 6 | -115,089 | 44 | 85,151 | 58 | 29,938 | 55 |
| Sugar | 931,602 | 25 | 79,090 | 53 | -96,963 | 50 | 17,873 | 30 |
| Soybeans | 832,618 | 52 | 209,730 | 82 | -176,080 | 24 | -33,650 | 14 |
| Gold | 512,842 | 23 | 186,706 | 47 | -211,434 | 53 | 24,728 | 34 |
| Wheat | 385,172 | 26 | -3,578 | 44 | 7,972 | 49 | -4,394 | 81 |
| Heating Oil | 349,618 | 31 | 6,455 | 52 | -32,434 | 37 | 25,979 | 88 |
| Coffee | 273,102 | 39 | 66,867 | 97 | -72,255 | 3 | 5,388 | 26 |
| Brent | 208,578 | 46 | -26,323 | 73 | 22,725 | 27 | 3,598 | 58 |
| Copper | 201,860 | 28 | 18,855 | 56 | -25,523 | 42 | 6,668 | 64 |
| Silver | 147,379 | 14 | 19,299 | 42 | -32,571 | 67 | 13,272 | 20 |
| Platinum | 58,766 | 20 | 11,759 | 19 | -16,638 | 85 | 4,879 | 30 |
| Palladium | 7,497 | 5 | -1,230 | 14 | 1,035 | 83 | 195 | 56 |
Gold Comex Futures:
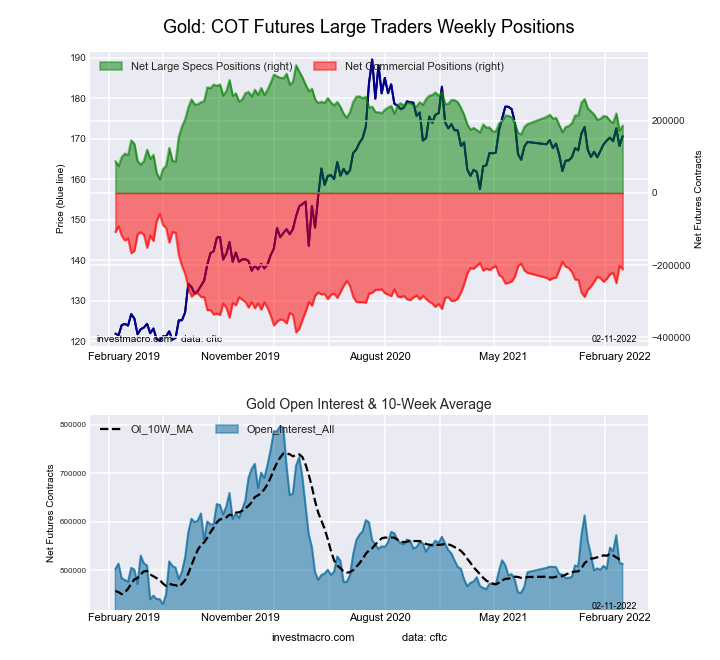
The Gold Comex Futures large speculator standing this week was a net position of 186,706 contracts in the data reported through Tuesday. This was a weekly advance of 14,564 contracts from the previous week which had a total of 172,142 net contracts.
This week’s current strength score (the trader positioning range over the past three years, measured from 0 to 100) shows the speculators are currently Bearish with a score of 47.2 percent. The commercials are Bullish with a score of 53.1 percent and the small traders (not shown in chart) are Bearish with a score of 34.3 percent.
| Gold Futures Statistics | SPECULATORS | COMMERCIALS | SMALL TRADERS |
| – Percent of Open Interest Longs: | 54.5 | 24.6 | 8.7 |
| – Percent of Open Interest Shorts: | 18.1 | 65.9 | 3.9 |
| – Net Position: | 186,706 | -211,434 | 24,728 |
| – Gross Longs: | 279,559 | 126,328 | 44,869 |
| – Gross Shorts: | 92,853 | 337,762 | 20,141 |
| – Long to Short Ratio: | 3.0 to 1 | 0.4 to 1 | 2.2 to 1 |
| NET POSITION TREND: | |||
| – Strength Index Score (3 Year Range Pct): | 47.2 | 53.1 | 34.3 |
| – Strength Index Reading (3 Year Range): | Bearish | Bullish | Bearish |
| NET POSITION MOVEMENT INDEX: | |||
| – 6-Week Change in Strength Index: | -8.4 | 10.4 | -22.1 |
Silver Comex Futures:
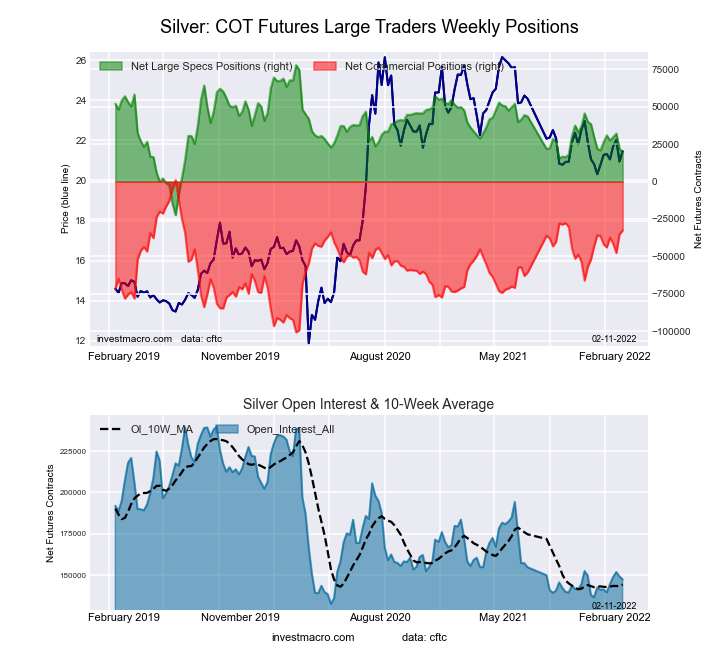
The Silver Comex Futures large speculator standing this week was a net position of 19,299 contracts in the data reported through Tuesday. This was a weekly decrease of -2,819 contracts from the previous week which had a total of 22,118 net contracts.
This week’s current strength score (the trader positioning range over the past three years, measured from 0 to 100) shows the speculators are currently Bearish with a score of 41.6 percent. The commercials are Bullish with a score of 66.9 percent and the small traders (not shown in chart) are Bearish with a score of 20.1 percent.
| Silver Futures Statistics | SPECULATORS | COMMERCIALS | SMALL TRADERS |
| – Percent of Open Interest Longs: | 38.6 | 35.9 | 17.8 |
| – Percent of Open Interest Shorts: | 25.5 | 58.0 | 8.8 |
| – Net Position: | 19,299 | -32,571 | 13,272 |
| – Gross Longs: | 56,905 | 52,943 | 26,231 |
| – Gross Shorts: | 37,606 | 85,514 | 12,959 |
| – Long to Short Ratio: | 1.5 to 1 | 0.6 to 1 | 2.0 to 1 |
| NET POSITION TREND: | |||
| – Strength Index Score (3 Year Range Pct): | 41.6 | 66.9 | 20.1 |
| – Strength Index Reading (3 Year Range): | Bearish | Bullish | Bearish |
| NET POSITION MOVEMENT INDEX: | |||
| – 6-Week Change in Strength Index: | -7.1 | 9.2 | -12.8 |
Copper Grade #1 Futures:
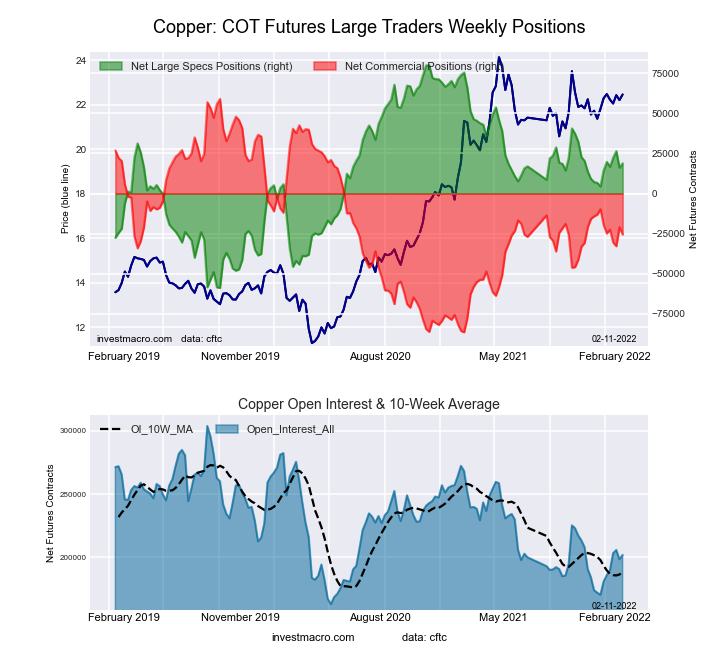
The Copper Grade #1 Futures large speculator standing this week was a net position of 18,855 contracts in the data reported through Tuesday. This was a weekly gain of 2,700 contracts from the previous week which had a total of 16,155 net contracts.
This week’s current strength score (the trader positioning range over the past three years, measured from 0 to 100) shows the speculators are currently Bullish with a score of 55.9 percent. The commercials are Bearish with a score of 41.9 percent and the small traders (not shown in chart) are Bullish with a score of 63.8 percent.
| Copper Futures Statistics | SPECULATORS | COMMERCIALS | SMALL TRADERS |
| – Percent of Open Interest Longs: | 36.8 | 41.2 | 9.0 |
| – Percent of Open Interest Shorts: | 27.5 | 53.9 | 5.7 |
| – Net Position: | 18,855 | -25,523 | 6,668 |
| – Gross Longs: | 74,302 | 83,203 | 18,191 |
| – Gross Shorts: | 55,447 | 108,726 | 11,523 |
| – Long to Short Ratio: | 1.3 to 1 | 0.8 to 1 | 1.6 to 1 |
| NET POSITION TREND: | |||
| – Strength Index Score (3 Year Range Pct): | 55.9 | 41.9 | 63.8 |
| – Strength Index Reading (3 Year Range): | Bullish | Bearish | Bullish |
| NET POSITION MOVEMENT INDEX: | |||
| – 6-Week Change in Strength Index: | 3.2 | -4.0 | 7.9 |
Platinum Futures:
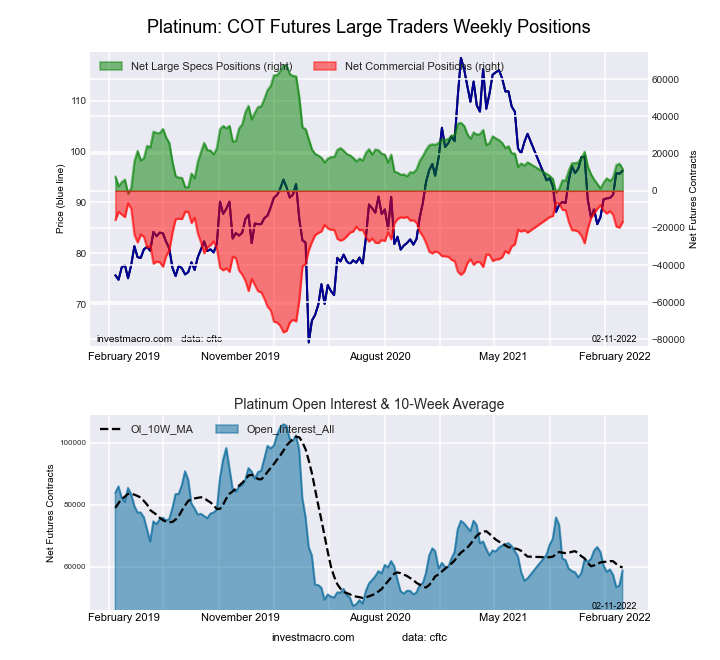
The Platinum Futures large speculator standing this week was a net position of 11,759 contracts in the data reported through Tuesday. This was a weekly lowering of -2,822 contracts from the previous week which had a total of 14,581 net contracts.
This week’s current strength score (the trader positioning range over the past three years, measured from 0 to 100) shows the speculators are currently Bearish-Extreme with a score of 18.7 percent. The commercials are Bullish-Extreme with a score of 85.3 percent and the small traders (not shown in chart) are Bearish with a score of 30.0 percent.
| Platinum Futures Statistics | SPECULATORS | COMMERCIALS | SMALL TRADERS |
| – Percent of Open Interest Longs: | 47.9 | 35.4 | 13.7 |
| – Percent of Open Interest Shorts: | 27.9 | 63.7 | 5.4 |
| – Net Position: | 11,759 | -16,638 | 4,879 |
| – Gross Longs: | 28,134 | 20,817 | 8,032 |
| – Gross Shorts: | 16,375 | 37,455 | 3,153 |
| – Long to Short Ratio: | 1.7 to 1 | 0.6 to 1 | 2.5 to 1 |
| NET POSITION TREND: | |||
| – Strength Index Score (3 Year Range Pct): | 18.7 | 85.3 | 30.0 |
| – Strength Index Reading (3 Year Range): | Bearish-Extreme | Bullish-Extreme | Bearish |
| NET POSITION MOVEMENT INDEX: | |||
| – 6-Week Change in Strength Index: | 10.6 | -8.6 | -18.3 |
Palladium Futures:
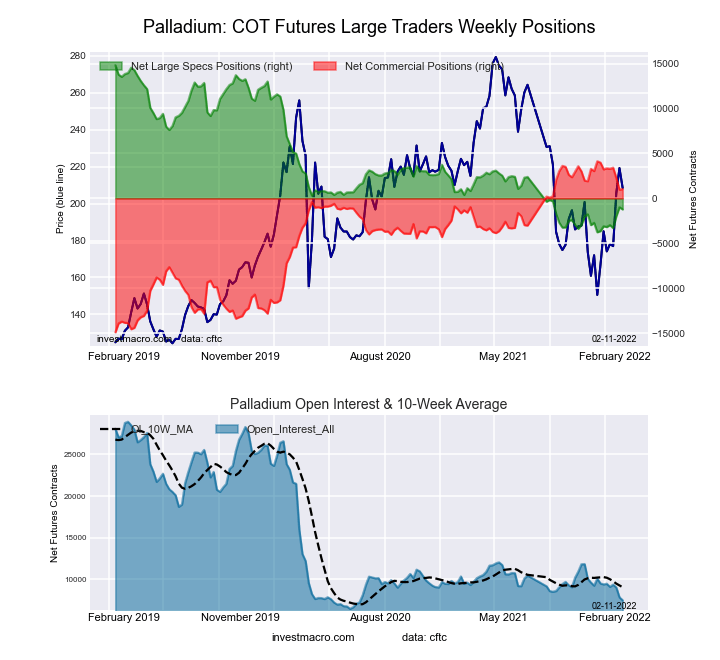
The Palladium Futures large speculator standing this week was a net position of -1,230 contracts in the data reported through Tuesday. This was a weekly decrease of -238 contracts from the previous week which had a total of -992 net contracts.
This week’s current strength score (the trader positioning range over the past three years, measured from 0 to 100) shows the speculators are currently Bearish-Extreme with a score of 13.9 percent. The commercials are Bullish-Extreme with a score of 83.5 percent and the small traders (not shown in chart) are Bullish with a score of 56.1 percent.
| Palladium Futures Statistics | SPECULATORS | COMMERCIALS | SMALL TRADERS |
| – Percent of Open Interest Longs: | 25.5 | 51.0 | 18.4 |
| – Percent of Open Interest Shorts: | 41.9 | 37.2 | 15.8 |
| – Net Position: | -1,230 | 1,035 | 195 |
| – Gross Longs: | 1,911 | 3,824 | 1,377 |
| – Gross Shorts: | 3,141 | 2,789 | 1,182 |
| – Long to Short Ratio: | 0.6 to 1 | 1.4 to 1 | 1.2 to 1 |
| NET POSITION TREND: | |||
| – Strength Index Score (3 Year Range Pct): | 13.9 | 83.5 | 56.1 |
| – Strength Index Reading (3 Year Range): | Bearish-Extreme | Bullish-Extreme | Bullish |
| NET POSITION MOVEMENT INDEX: | |||
| – 6-Week Change in Strength Index: | 10.3 | -11.7 | 18.6 |
*COT Report: The COT data, released weekly to the public each Friday, is updated through the most recent Tuesday (data is 3 days old) and shows a quick view of how large speculators or non-commercials (for-profit traders) were positioned in the futures markets.
The CFTC categorizes trader positions according to commercial hedgers (traders who use futures contracts for hedging as part of the business), non-commercials (large traders who speculate to realize trading profits) and nonreportable traders (usually small traders/speculators) as well as their open interest (contracts open in the market at time of reporting).See CFTC criteria here.


Comments
Log in or sign up to join the conversation.