
Here are the latest charts and statistics for the Commitment of Traders (COT) data published by the Commodities Futures Trading Commission (CFTC).
The latest COT data is updated through Tuesday May 24th and shows a quick view of how large traders (for-profit speculators and commercial entities) were positioned in the futures markets.
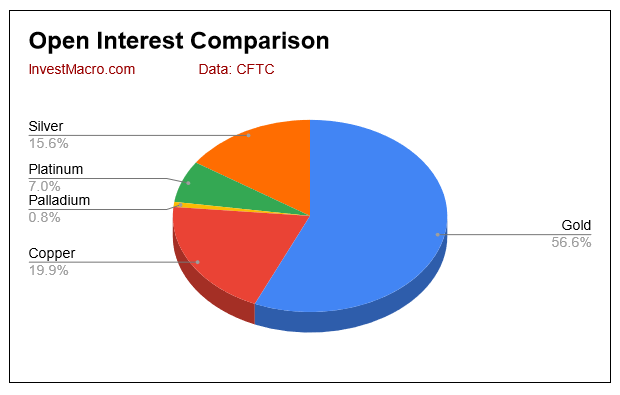
Highlighting the COT metals data is the bounce-back in Gold and Copper speculator bets after multiple down weeks for both of these metals. Copper positions saw a small turnaround with a +4,775 contract gain this week after falling for six consecutive weeks which amounted to a total drop by -60,550 net positions from April 12th to May 17th. Copper has been particularly hard hit by the lockdowns in China and the effect that it has had on the industrial and manufacturing economy there. Copper speculator bets have now been oscillating at the lowest levels in approximately two years.
Gold positions, meanwhile, rose by +8,453 contracts this week after declining in the previous five weeks and by a total of -78,927 contracts in that period. Gold bullish bets are under the +200,000 net contract level for a fourth straight week after spending the previous ten weeks above that threshold. Currently in 2022, Gold positions are averaging +221,416 weekly contracts so far compared to an average of +204,623 weekly contracts over 2021 and an average of +262,052 weekly contracts over 2020.
Overall, the markets with higher speculator bets this week were Gold (8,453 contracts) and Copper (4,775 contracts) while the markets with declining speculator bets this week were Silver (-2,011 contracts), Platinum (-718 contracts) and Palladium (-257 contracts).
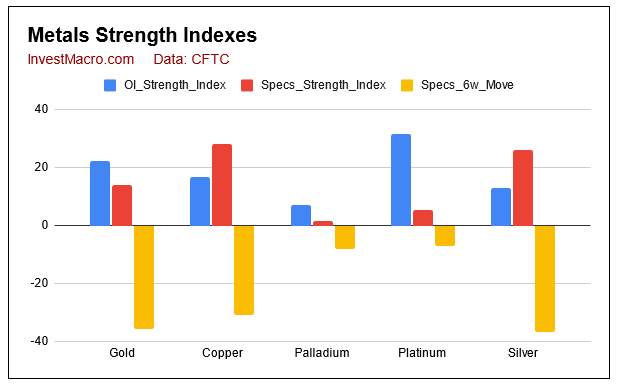
Speculator strength standings for each market where strength index is current net position compared to past three years, above 80 is bullish extreme, below 20 is bearish extreme
- OI Strength = Current Open Interest level compared to last 3 years range
- Spec Strength = Current Net Speculator level compared to last 3 years range
- Strength Move = Six week change of Spec Strength
Data Snapshot of Commodity Market Traders | Columns Legend
| WTI Crude | 1,711,863 | 0 | 334,761 | 11 | -374,627 | 91 | 39,866 | 71 |
| Corn | 1,544,885 | 29 | 427,848 | 85 | -372,522 | 19 | -55,326 | 11 |
| Natural Gas | 1,107,496 | 6 | -111,570 | 45 | 63,847 | 51 | 47,723 | 93 |
| Sugar | 847,420 | 11 | 209,487 | 80 | -255,450 | 20 | 45,963 | 65 |
| Soybeans | 729,900 | 28 | 188,368 | 72 | -159,047 | 34 | -29,321 | 21 |
| Gold | 530,098 | 22 | 183,813 | 14 | -211,947 | 82 | 28,134 | 37 |
| Heating Oil | 349,618 | 31 | 6,455 | 52 | -32,434 | 37 | 25,979 | 88 |
| Wheat | 326,607 | 8 | 26,344 | 53 | -24,339 | 25 | -2,005 | 100 |
| Coffee | 211,266 | 5 | 37,072 | 71 | -38,484 | 34 | 1,412 | 4 |
| Copper | 186,433 | 17 | -19,633 | 28 | 19,288 | 73 | 345 | 27 |
| Brent | 183,629 | 27 | -39,289 | 45 | 37,488 | 56 | 1,801 | 34 |
| Silver | 146,456 | 13 | 14,103 | 26 | -23,297 | 88 | 9,194 | 3 |
| Platinum | 65,824 | 32 | 1,485 | 5 | -6,683 | 96 | 5,198 | 34 |
| Palladium | 7,919 | 7 | -3,472 | 2 | 3,800 | 98 | -328 | 25 |
Gold Comex Futures:
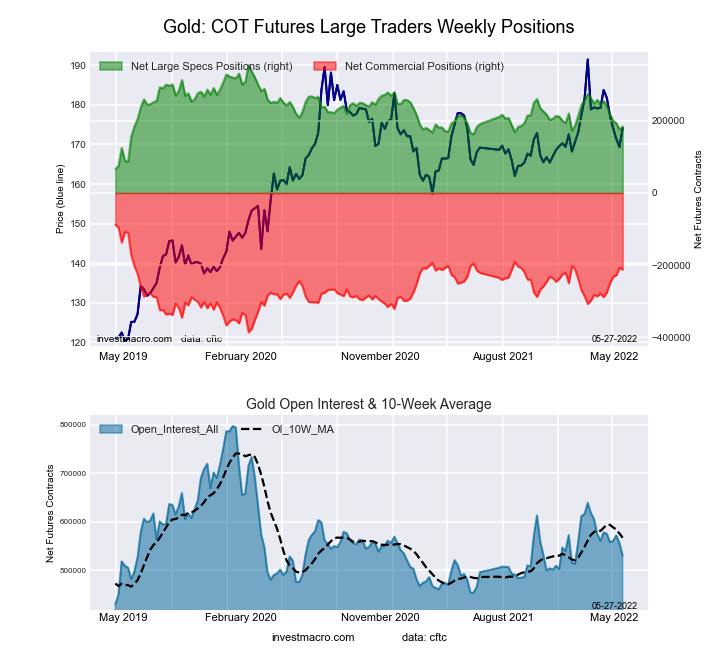
The Gold Comex Futures large speculator standing this week was a net position of 183,813 contracts in the data reported through Tuesday. This was a weekly boost of 8,453 contracts from the previous week which had a total of 175,360 net contracts.
This week’s current strength score (the trader positioning range over the past three years, measured from 0 to 100) shows the speculators are currently Bearish-Extreme with a score of 14.0 percent. The commercials are Bullish-Extreme with a score of 81.5 percent and the small traders (not shown in chart) are Bearish with a score of 37.2 percent.
| Gold Futures Statistics | SPECULATORS | COMMERCIALS | SMALL TRADERS |
| – Percent of Open Interest Longs: | 53.2 | 24.6 | 8.9 |
| – Percent of Open Interest Shorts: | 18.6 | 64.6 | 3.6 |
| – Net Position: | 183,813 | -211,947 | 28,134 |
| – Gross Longs: | 282,202 | 130,364 | 47,411 |
| – Gross Shorts: | 98,389 | 342,311 | 19,277 |
| – Long to Short Ratio: | 2.9 to 1 | 0.4 to 1 | 2.5 to 1 |
| NET POSITION TREND: | |||
| – Strength Index Score (3 Year Range Pct): | 14.0 | 81.5 | 37.2 |
| – Strength Index Reading (3 Year Range): | Bearish-Extreme | Bullish-Extreme | Bearish |
| NET POSITION MOVEMENT INDEX: | |||
| – 6-Week Change in Strength Index: | -35.7 | 35.7 | -18.1 |
Silver Comex Futures:
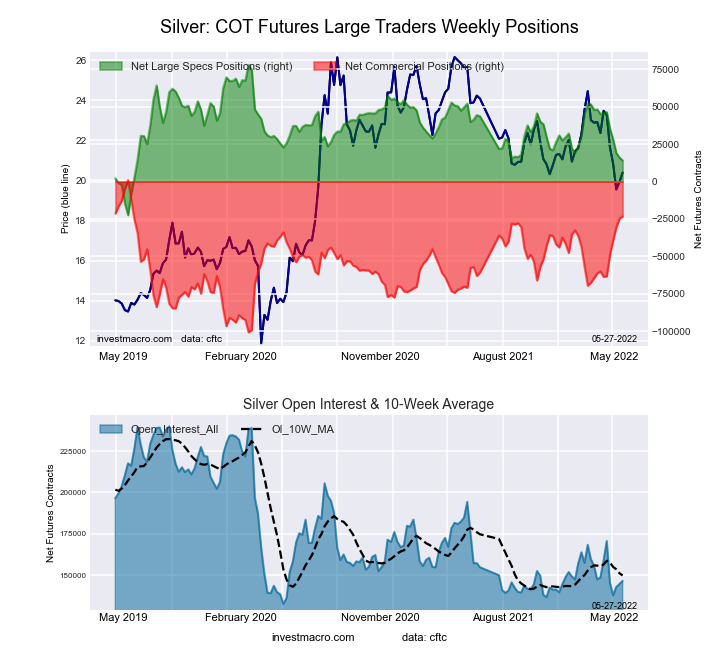
The Silver Comex Futures large speculator standing this week was a net position of 14,103 contracts in the data reported through Tuesday. This was a weekly reduction of -2,011 contracts from the previous week which had a total of 16,114 net contracts.
This week’s current strength score (the trader positioning range over the past three years, measured from 0 to 100) shows the speculators are currently Bearish with a score of 26.1 percent. The commercials are Bullish-Extreme with a score of 87.6 percent and the small traders (not shown in chart) are Bearish-Extreme with a score of 2.6 percent.
| Silver Futures Statistics | SPECULATORS | COMMERCIALS | SMALL TRADERS |
| – Percent of Open Interest Longs: | 40.1 | 38.9 | 15.7 |
| – Percent of Open Interest Shorts: | 30.5 | 54.8 | 9.5 |
| – Net Position: | 14,103 | -23,297 | 9,194 |
| – Gross Longs: | 58,748 | 56,910 | 23,064 |
| – Gross Shorts: | 44,645 | 80,207 | 13,870 |
| – Long to Short Ratio: | 1.3 to 1 | 0.7 to 1 | 1.7 to 1 |
| NET POSITION TREND: | |||
| – Strength Index Score (3 Year Range Pct): | 26.1 | 87.6 | 2.6 |
| – Strength Index Reading (3 Year Range): | Bearish | Bullish-Extreme | Bearish-Extreme |
| NET POSITION MOVEMENT INDEX: | |||
| – 6-Week Change in Strength Index: | -36.9 | 45.6 | -46.6 |
Copper Grade #1 Futures:
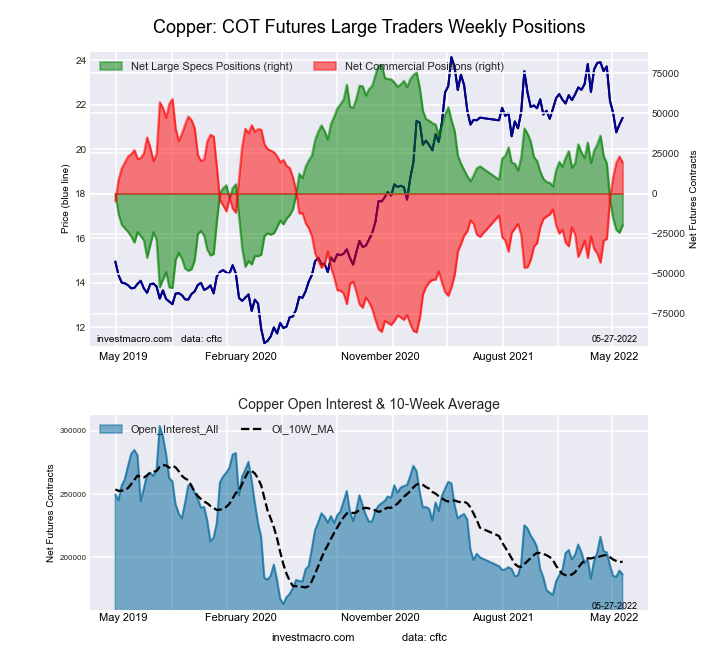
The Copper Grade #1 Futures large speculator standing this week was a net position of -19,633 contracts in the data reported through Tuesday. This was a weekly gain of 4,775 contracts from the previous week which had a total of -24,408 net contracts.
This week’s current strength score (the trader positioning range over the past three years, measured from 0 to 100) shows the speculators are currently Bearish with a score of 28.2 percent. The commercials are Bullish with a score of 72.7 percent and the small traders (not shown in chart) are Bearish with a score of 27.3 percent.
| Copper Futures Statistics | SPECULATORS | COMMERCIALS | SMALL TRADERS |
| – Percent of Open Interest Longs: | 29.0 | 53.3 | 8.0 |
| – Percent of Open Interest Shorts: | 39.6 | 42.9 | 7.9 |
| – Net Position: | -19,633 | 19,288 | 345 |
| – Gross Longs: | 54,130 | 99,318 | 14,993 |
| – Gross Shorts: | 73,763 | 80,030 | 14,648 |
| – Long to Short Ratio: | 0.7 to 1 | 1.2 to 1 | 1.0 to 1 |
| NET POSITION TREND: | |||
| – Strength Index Score (3 Year Range Pct): | 28.2 | 72.7 | 27.3 |
| – Strength Index Reading (3 Year Range): | Bearish | Bullish | Bearish |
| NET POSITION MOVEMENT INDEX: | |||
| – 6-Week Change in Strength Index: | -30.9 | 33.4 | -32.1 |
Platinum Futures:
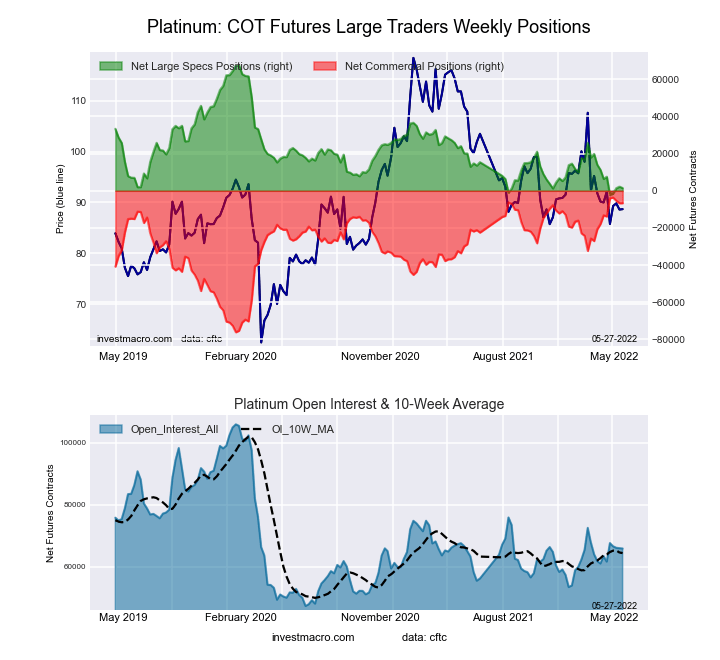
The Platinum Futures large speculator standing this week was a net position of 1,485 contracts in the data reported through Tuesday. This was a weekly reduction of -718 contracts from the previous week which had a total of 2,203 net contracts.
This week’s current strength score (the trader positioning range over the past three years, measured from 0 to 100) shows the speculators are currently Bearish-Extreme with a score of 5.5 percent. The commercials are Bullish-Extreme with a score of 95.8 percent and the small traders (not shown in chart) are Bearish with a score of 34.5 percent.
| Platinum Futures Statistics | SPECULATORS | COMMERCIALS | SMALL TRADERS |
| – Percent of Open Interest Longs: | 39.6 | 41.0 | 13.0 |
| – Percent of Open Interest Shorts: | 37.3 | 51.2 | 5.1 |
| – Net Position: | 1,485 | -6,683 | 5,198 |
| – Gross Longs: | 26,052 | 27,002 | 8,533 |
| – Gross Shorts: | 24,567 | 33,685 | 3,335 |
| – Long to Short Ratio: | 1.1 to 1 | 0.8 to 1 | 2.6 to 1 |
| NET POSITION TREND: | |||
| – Strength Index Score (3 Year Range Pct): | 5.5 | 95.8 | 34.5 |
| – Strength Index Reading (3 Year Range): | Bearish-Extreme | Bullish-Extreme | Bearish |
| NET POSITION MOVEMENT INDEX: | |||
| – 6-Week Change in Strength Index: | -7.0 | 9.0 | -22.7 |
Palladium Futures:
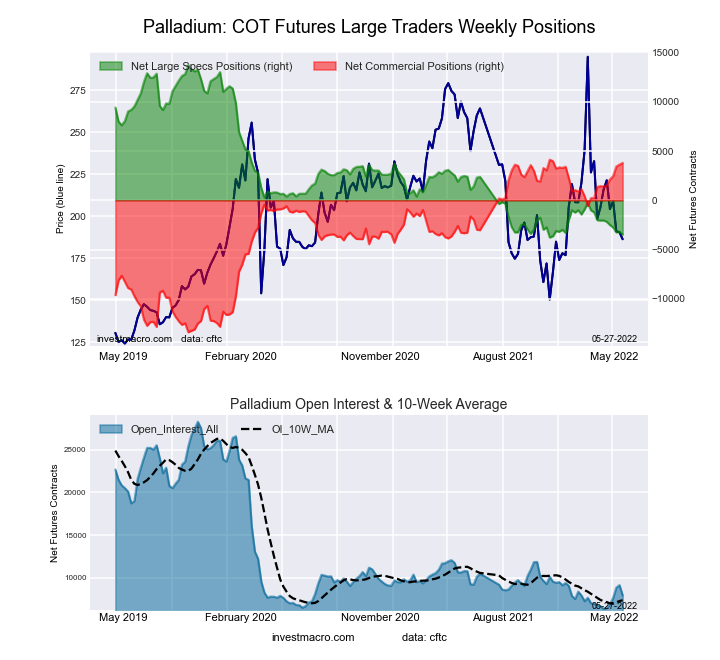
The Palladium Futures large speculator standing this week was a net position of -3,472 contracts in the data reported through Tuesday. This was a weekly decline of -257 contracts from the previous week which had a total of -3,215 net contracts.
This week’s current strength score (the trader positioning range over the past three years, measured from 0 to 100) shows the speculators are currently Bearish-Extreme with a score of 1.7 percent. The commercials are Bullish-Extreme with a score of 98.1 percent and the small traders (not shown in chart) are Bearish with a score of 24.9 percent.
| Palladium Futures Statistics | SPECULATORS | COMMERCIALS | SMALL TRADERS |
| – Percent of Open Interest Longs: | 9.2 | 70.1 | 12.3 |
| – Percent of Open Interest Shorts: | 53.0 | 22.2 | 16.4 |
| – Net Position: | -3,472 | 3,800 | -328 |
| – Gross Longs: | 729 | 5,555 | 974 |
| – Gross Shorts: | 4,201 | 1,755 | 1,302 |
| – Long to Short Ratio: | 0.2 to 1 | 3.2 to 1 | 0.7 to 1 |
| NET POSITION TREND: | |||
| – Strength Index Score (3 Year Range Pct): | 1.7 | 98.1 | 24.9 |
| – Strength Index Reading (3 Year Range): | Bearish-Extreme | Bullish-Extreme | Bearish |
| NET POSITION MOVEMENT INDEX: | |||
| – 6-Week Change in Strength Index: | -8.2 | 13.7 | -55.5 |
*COT Report: The COT data, released weekly to the public each Friday, is updated through the most recent Tuesday (data is 3 days old) and shows a quick view of how large speculators or non-commercials (for-profit traders) were positioned in the futures markets.
The CFTC categorizes trader positions according to commercial hedgers (traders who use futures contracts for hedging as part of the business), non-commercials (large traders who speculate to realize trading profits) and nonreportable traders (usually small traders/speculators) as well as their open interest (contracts open in the market at time of reporting).See CFTC criteria here.


Comments
Log in or sign up to join the conversation.