

Image Source: Unsplash

Here are the latest charts and statistics for the Commitment of Traders (COT) data published by the Commodities Futures Trading Commission (CFTC). The latest COT data is updated through Tuesday, March 21, and it shows a quick view of how large traders (for-profit speculators and commercial entities) were positioned in the futures markets.
This COT data is fully up-to-date after weeks of delays due to a cybersecurity event that happened in early February to ION Cleared Derivatives (a subsidiary of ION Markets). The hacking incident had disrupted the ability for the CFTC to report large trader positions.
Weekly Speculator Changes Led by Silver & Gold

The COT metals markets speculator bets were higher this week, as three out of the five precious metals markets we cover had higher positioning while the other two markets had lower speculator contracts. Leading the gains for the metals was gold (18,274 contracts), with silver (4,681 contracts) and copper (1,805 contracts) also experiencing positive weeks.
The main metal with declines in speculator bets for the week was platinum (-1,047 contracts), although palladium (-550 contracts) also registered lower bets.
Gold Bets on The Rise
Highlighting the COT metals data this week is the recent bullishness for the gold speculative positions. The large speculator position in gold futures advanced this week for a second straight week, and for the fourth time out of the past five weeks.
The gold position had gone from a total net position of +105,529 contracts on Feb. 14 to a new seven-week high at a total of +158,605 contracts, with the five-week total of speculator bets showing a gain of +53,076 contracts. The speculator strength score (0 to 100 range) for gold has risen to 47% while the six-week speculator strength score trend has shown a rise of 13%.
The gold futures price closed below the $1,995 level this week after touching its highest point in just about a year, as it reached over the $2,014.00 threshold on Monday. Gold has gained over 20% since its recent low levels in early November which saw the price fall to approximately $1,618.30.
Data Snapshot of Commodity Market Traders | Columns Legend
|
Mar-21-2023 |
OI |
OI-Index |
Spec-Net |
Spec-Index |
Com-Net |
COM-Index |
Smalls-Net |
Smalls-Index |
|---|---|---|---|---|---|---|---|---|
|
Gold |
469,874 |
22 |
158,605 |
47 |
-183,568 |
53 |
24,963 |
43 |
|
Copper |
201,636 |
44 |
-12,351 |
17 |
7,536 |
80 |
4,815 |
49 |
|
Silver |
119,082 |
0 |
3,462 |
23 |
-12,681 |
79 |
9,219 |
17 |
|
Platinum |
61,416 |
45 |
9,526 |
38 |
-14,141 |
64 |
4,615 |
30 |
|
Palladium |
11,647 |
80 |
-7,018 |
1 |
7,369 |
100 |
-351 |
21 |
Strength Scores Led by Gold & Platinum

COT strength scores (a normalized measure of speculator positions over a three-year range from 0 to 100, where above 80 is Extreme-Bullish and below 20 is Extreme-Bearish) showed that the gold (47%) led the metals markets this week. Platinum (38%) comes in as the next highest in terms of the weekly strength scores.
On the downside, palladium (1%) and copper (17%) come in at the lowest strength levels currently, and they are in Extreme-Bearish territory (below 20%).
Strength statistics:
- Gold (46.9%) vs. gold the previous week (38.8%).
- Silver (23.2%) vs. silver the previous week (16.5%).
- Copper (17.4%) vs. copper the previous week (15.8%).
- Platinum (37.6%) vs. platinum the previous week (40.0%).
- Palladium (0.7%) vs. palladium the previous week (5.8%).
Gold & Platinum Top the Six-Week Strength Trends
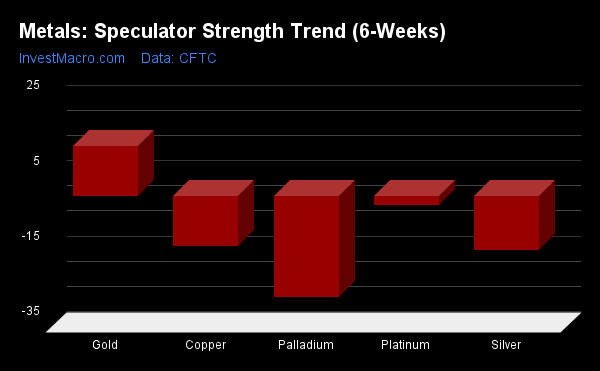
COT strength score trends (otherwise called the move index, which calculates the six-week changes in strength scores) showed that gold (13%) led the market trends over the past six weeks, and it has been the only positive mover for the metals.
Palladium (-27%) led the downside trend scores, with silver (-14%) following behind with the next lowest trend scores.
Move statistics:
- Gold (13.1%) vs. gold the previous week (-8.8%).
- Silver (-14.4%) vs. silver the previous week (-40.7%).
- Copper (-13.3%) vs. copper the previous week (-28.1%).
- Platinum (-2.5%) vs. platinum the previous week (-12.8%).
- Palladium (-26.9%) vs. palladium the previous week (-20.3%).
Individual Markets - Gold Comex Futures

The gold Comex futures large speculator standing this week was a net position of 158,605 contracts in the data reported through Tuesday. This was a weekly rise of 18,274 contracts from the previous week, which had a total of 140,331 net contracts.
This week’s current strength score (the trader positioning range over the past three years, measured from 0 to 100) shows that the speculators are currently Bearish with a score of 46.9%. The commercials are Bullish with a score of 53.1%, and the small traders (not shown in chart) are Bearish with a score of 42.5%.
|
Gold Futures Statistics |
SPECULATORS |
COMMERCIALS |
SMALL TRADERS |
|
–% of Open Interest Longs: |
50.6 |
25.9 |
10.1 |
|
–% of Open Interest Shorts: |
16.9 |
65.0 |
4.8 |
|
– Net Position: |
158,605 |
-183,568 |
24,963 |
|
– Gross Longs: |
237,891 |
121,678 |
47,624 |
|
– Gross Shorts: |
79,286 |
305,246 |
22,661 |
|
– Long to Short Ratio: |
3.0 to 1 |
0.4 to 1 |
2.1 to 1 |
|
NET POSITION TREND: |
|
|
|
|
– Strength Index Score (3 Year Range Pct): |
46.9 |
53.1 |
42.5 |
|
– Strength Index Reading (3 Year Range): |
Bearish |
Bullish |
Bearish |
|
NET POSITION MOVEMENT INDEX: |
|
|
|
|
– 6-Week Change in Strength Index: |
13.1 |
-11.8 |
2.0 |
Silver Comex Futures

The silver Comex futures large speculator standing this week was a net position of 3,462 contracts in the data reported through Tuesday. This was a weekly lift of 4,681 contracts from the previous week, which had a total of -1,219 net contracts.
This week’s current strength score shows the speculators are currently Bearish with a score of 23.2%. The commercials are Bullish with a score of 78.5%, and the small traders are Bearish-Extreme with a score of 17.4%.
|
Silver Futures Statistics |
SPECULATORS |
COMMERCIALS |
SMALL TRADERS |
|
–% of Open Interest Longs: |
34.7 |
40.9 |
18.8 |
|
–% of Open Interest Shorts: |
31.8 |
51.5 |
11.0 |
|
– Net Position: |
3,462 |
-12,681 |
9,219 |
|
– Gross Longs: |
41,325 |
48,685 |
22,328 |
|
– Gross Shorts: |
37,863 |
61,366 |
13,109 |
|
– Long to Short Ratio: |
1.1 to 1 |
0.8 to 1 |
1.7 to 1 |
|
NET POSITION TREND: |
|
|
|
|
– Strength Index Score (3 Year Range Pct): |
23.2 |
78.5 |
17.4 |
|
– Strength Index Reading (3 Year Range): |
Bearish |
Bullish |
Bearish-Extreme |
|
NET POSITION MOVEMENT INDEX: |
|
|
|
|
– 6-Week Change in Strength Index: |
-14.4 |
20.6 |
-38.8 |
Copper Grade #1 Futures

The copper Grade #1 futures large speculator standing this week was a net position of -12,351 contracts in the data reported through Tuesday. This was a weekly lift of 1,805 contracts from the previous week, which had a total of -14,156 net contracts.
This week’s current strength score shows the speculators are currently Bearish-Extreme with a score of 17.4%. The commercials are Bullish with a score of 79.8%, and the small traders are Bearish with a score of 49.2%.
|
Copper Futures Statistics |
SPECULATORS |
COMMERCIALS |
SMALL TRADERS |
|
–% of Open Interest Longs: |
25.3 |
46.8 |
8.7 |
|
–% of Open Interest Shorts: |
31.5 |
43.1 |
6.3 |
|
– Net Position: |
-12,351 |
7,536 |
4,815 |
|
– Gross Longs: |
51,095 |
94,353 |
17,564 |
|
– Gross Shorts: |
63,446 |
86,817 |
12,749 |
|
– Long to Short Ratio: |
0.8 to 1 |
1.1 to 1 |
1.4 to 1 |
|
NET POSITION TREND: |
|
|
|
|
– Strength Index Score (3 Year Range Pct): |
17.4 |
79.8 |
49.2 |
|
– Strength Index Reading (3 Year Range): |
Bearish-Extreme |
Bullish |
Bearish |
|
NET POSITION MOVEMENT INDEX: |
|
|
|
|
– 6-Week Change in Strength Index: |
-13.3 |
15.9 |
-24.3 |
Platinum Futures

The platinum futures large speculator standing this week was a net position of 9,526 contracts in the data reported through Tuesday. This was a weekly fall of -1,047 contracts from the previous week, which had a total of 10,573 net contracts.
This week’s current strength score shows the speculators are currently Bearish with a score of 37.6%. The commercials are Bullish with a score of 64.2%, and the small traders are Bearish with a score of 29.9%.
|
Platinum Futures Statistics |
SPECULATORS |
COMMERCIALS |
SMALL TRADERS |
|
–% of Open Interest Longs: |
41.0 |
39.7 |
12.1 |
|
–% of Open Interest Shorts: |
25.5 |
62.8 |
4.6 |
|
– Net Position: |
9,526 |
-14,141 |
4,615 |
|
– Gross Longs: |
25,199 |
24,399 |
7,431 |
|
– Gross Shorts: |
15,673 |
38,540 |
2,816 |
|
– Long to Short Ratio: |
1.6 to 1 |
0.6 to 1 |
2.6 to 1 |
|
NET POSITION TREND: |
|
|
|
|
– Strength Index Score (3 Year Range Pct): |
37.6 |
64.2 |
29.9 |
|
– Strength Index Reading (3 Year Range): |
Bearish |
Bullish |
Bearish |
|
NET POSITION MOVEMENT INDEX: |
|
|
|
|
– 6-Week Change in Strength Index: |
-2.5 |
4.9 |
-17.2 |
Palladium Futures

The palladium futures large speculator standing this week was a net position of -7,018 contracts in the data reported through Tuesday. This was a weekly fall of -550 contracts from the previous week, which had a total of -6,468 net contracts.
This week’s current strength score shows the speculators are currently Bearish-Extreme with a score of 0.7%. The commercials are Bullish-Extreme with a score of 99.6%, and the small traders are Bearish with a score of 20.6%.
|
Palladium Futures Statistics |
SPECULATORS |
COMMERCIALS |
SMALL TRADERS |
|
–% of Open Interest Longs: |
14.0 |
73.0 |
10.6 |
|
–% of Open Interest Shorts: |
74.3 |
9.7 |
13.6 |
|
– Net Position: |
-7,018 |
7,369 |
-351 |
|
– Gross Longs: |
1,633 |
8,498 |
1,234 |
|
– Gross Shorts: |
8,651 |
1,129 |
1,585 |
|
– Long to Short Ratio: |
0.2 to 1 |
7.5 to 1 |
0.8 to 1 |
|
NET POSITION TREND: |
|
|
|
|
– Strength Index Score (3 Year Range Pct): |
0.7 |
99.6 |
20.6 |
|
– Strength Index Reading (3 Year Range): |
Bearish-Extreme |
Bullish-Extreme |
Bearish |
|
NET POSITION MOVEMENT INDEX: |
|
|
|
|
– 6-Week Change in Strength Index: |
-26.9 |
25.1 |
-3.5 |
Article By InvestMacro – Receive our weekly COT Newsletter.
COT Report: The COT data, released weekly to the public each Friday, is updated through the most recent Tuesday (data is three days old) and shows a quick view of how large speculators or non-commercials (for-profit traders) were positioned in the futures markets.
The CFTC categorizes trader positions according to commercial hedgers (traders who use futures contracts for hedging as part of the business), non-commercials (large traders who speculate to realize trading profits), and non-reportable traders (usually small traders/speculators), as well as their open interest (contracts open in the market at time of reporting). See CFTC criteria here.
More By This Author:
Soft Commodities Speculators Drop Lean Hogs Bets For 4th Week To 134-Week Low
Large Metals Speculators Continue To Boost Gold Bullish Bets To 30-Week High
Speculators Weekly: Soybean Meal, Heating Oil & Wheat Lead Bullish & Bearish Positions


Comments
Log in or sign up to join the conversation.