

Image Source: Unsplash
Here are the latest charts and statistics for the Commitment of Traders (COT) data published by the Commodities Futures Trading Commission (CFTC).
The latest COT data is updated through Tuesday, Oct. 18, and it shows a quick view of how large traders (for-profit speculators and commercial entities) were positioned in the futures markets.
Platinum Tops Weekly Speculator Changes
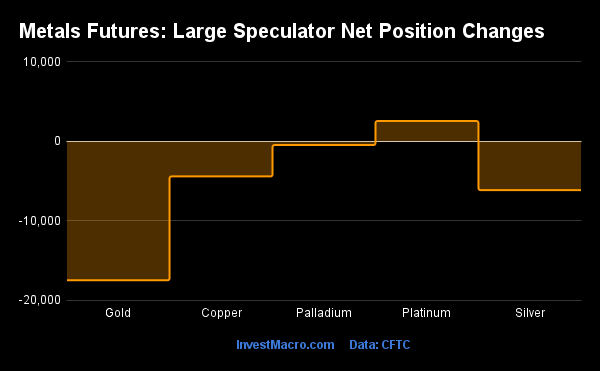
The COT precious metals speculator bets were lower this week as just one out of the five metals markets we cover had higher positioning this week, while four markets had lower contracts.
Leading the precious metals markets was platinum (2,566 contracts), as it experienced a positive week. The metals markets leading the declines in speculator bets this week were gold (-17,464 contracts), silver (-6,122 contracts), copper (-4,403 contracts), and palladium (-455 contracts), as they all registered lower bets on the week.
Highlighting the COT Metals data this week was the speculator positions in platinum. The large speculative positions rose this week for a third straight week and for the fifth time in the past six weeks. Over the past six weeks, speculative bets have improved by a total of +15,245 contracts. This recent bullishness has brought the overall net standing to its highest level in the past twenty-eight weeks, dating back to April 5 of this year.
Platinum prices have been on the rise as well with a monthly gain above 8% so far in October. Platinum could also benefit going forward from an interesting tax loophole in India that has pushed platinum imports to a record high of approximately 27 tons this September compared to a little over 1 ton last September, according to Reuters.
Indian gold refiners are importing platinum mixed with gold to offset new higher taxes on gold. A gold/platinum mix allows importers to classify the import as a platinum alloy and pay a lower tax rate on it.
Platinum futures closed this week over 4% higher near the $933 level yet below the $940 level, which has acted as a resistance barrier over the past five weeks.
Data Snapshot of Commodity Market Traders | Columns Legend
| WTI Crude | 1,454,431 | 0 | 251,545 | 11 | -273,757 | 90 | 22,212 | 37 |
| Corn | 1,419,087 | 22 | 312,419 | 70 | -249,255 | 36 | -63,164 | 7 |
| Natural Gas | 963,792 | 3 | -154,734 | 32 | 126,760 | 71 | 27,974 | 46 |
| Soybeans | 714,532 | 30 | 54,683 | 30 | -30,595 | 77 | -24,088 | 30 |
| Sugar | 711,664 | 4 | 126,412 | 63 | -164,671 | 37 | 38,259 | 55 |
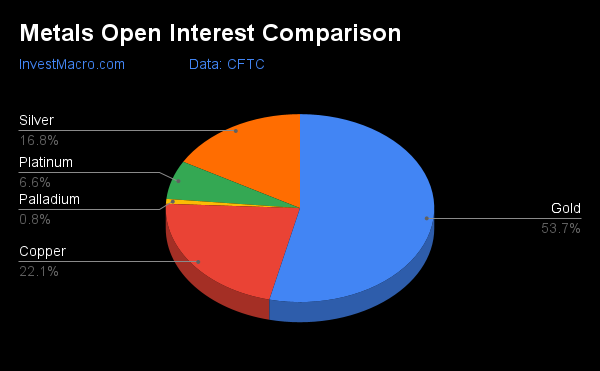
| Gold | 434,701 | 1 | 76,956 | 8 | -90,030 | 91 | 13,074 | 12 |
| Wheat | 309,429 | 10 | -3,541 | 14 | 10,534 | 75 | -6,993 | 74 |
| Heating Oil | 283,702 | 29 | 24,555 | 79 | -44,031 | 24 | 19,476 | 66 |
| Coffee | 196,729 | 9 | 19,223 | 53 | -21,605 | 52 | 2,382 | 24 |
| Copper | 178,730 | 17 | -20,302 | 20 | 19,696 | 82 | 606 | 29 |
| Brent | 163,296 | 11 | -41,847 | 41 | 38,681 | 58 | 3,166 | 52 |
| Silver | 136,055 | 9 | 1,267 | 15 | -9,085 | 87 | 7,818 | 8 |
| Platinum | 53,728 | 11 | 8,494 | 21 | -11,632 | 81 | 3,138 | 10 |
| Palladium | 6,805 | 4 | -1,209 | 16 | 1,444 | 82 | -235 | 30 |
Strength Scores Led by Platinum and Copper
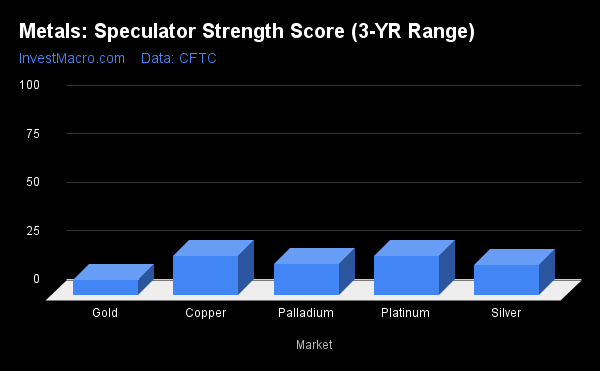
Strength scores (which are a measure of the three-year range of speculator positions, from 0 to 100 where above 80 is extreme bullish and below 20 is extreme bearish) showed that platinum (20.5%) and copper (20.2%) lead the metals this week, just above the bearish extreme level.
On the downside, gold (8.2%) continued to be at the lowest strength level, followed by silver (15.5%) and palladium (16.4%). All three markets have been in extreme bearish levels below 20%.
Strength statistics:
- Gold (8.2%) vs. gold the previous week (14.0%).
- Silver (15.5%) vs. silver the previous week (22.3%).
- Copper (20.2%) vs. copper the previous week (23.7%).
- Platinum (20.5%) vs. platinum the previous week (17.1%).
- Palladium (16.4%) vs. palladium the previous week (19.1%).
Platinum Leads the Strength Trend Scores
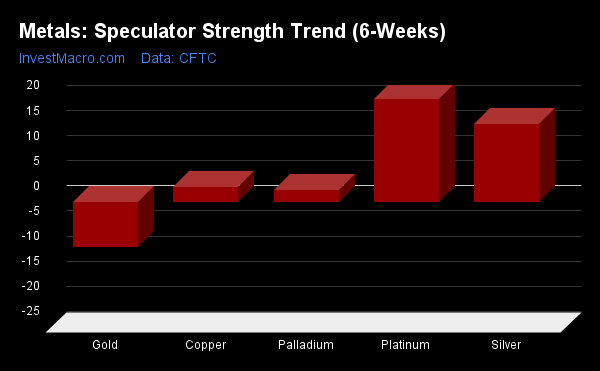
Strength score trends (also called the move index, which calculates the six-week changes in strength scores) show that platinum (20.5%) has been the leader of the market trends for the past six weeks. Silver (15.5%), copper (2.9%), and palladium (2.3%) have also served as positive movers in the latest trends data.
However, gold (-8.9%) has served as the leader for downside trends, as it has been the only negative mover in the recent data.
Move statistics:
- Gold (-8.9%) vs. gold the previous week (-7.7%).
- Silver (15.5%) vs. silver the previous week (17.3%).
- Copper (2.9%) vs. copper the previous week (5.9%).
- Platinum (20.5%) vs. platinum the previous week (15.2%).
- Palladium (2.3%) vs. palladium the previous week (2.2%).
Individual Markets - Gold Comex Futures
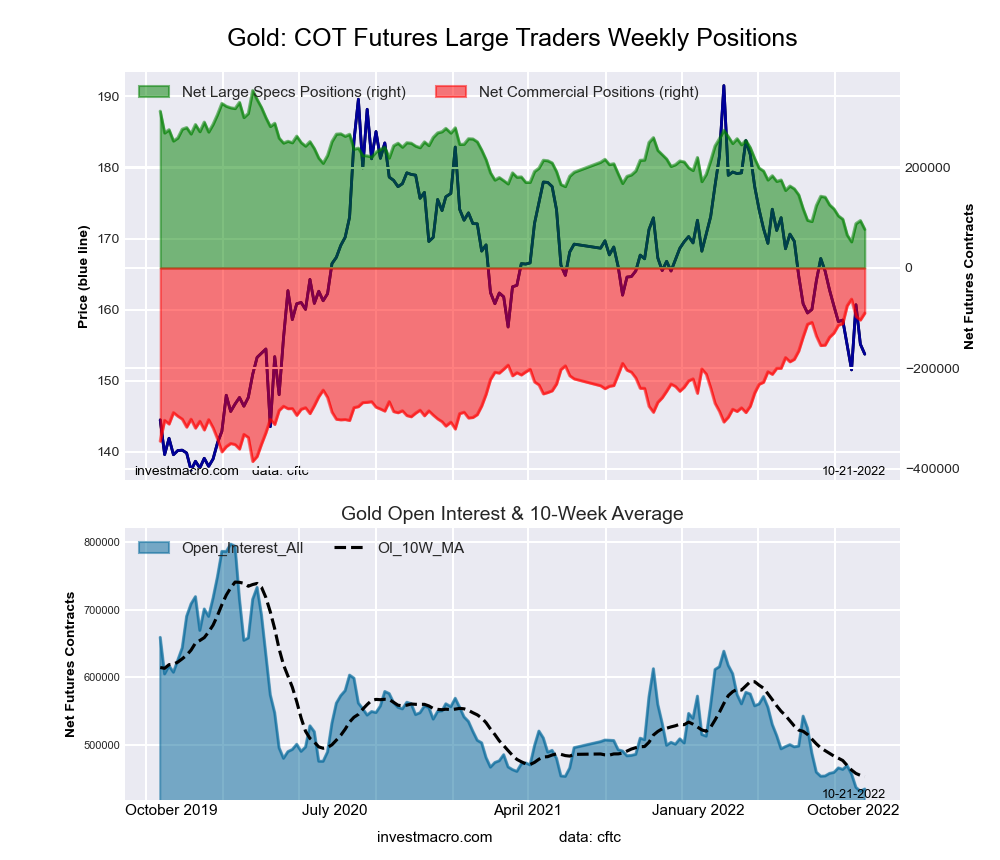
The gold Comex futures large speculator standing this week came in at a net position of 76,956 contracts in the data reported through Tuesday. This was a weekly reduction of -17,464 contracts from the previous week, which had a total of 94,420 net contracts.
This week’s current strength score (the trader positioning range over the past three years, measured from 0 to 100) shows the speculators are currently Bearish-Extreme with a score of 8.2%. The commercials are Bullish-Extreme with a score of 91.4% and the small traders (not shown in chart) are Bearish-Extreme with a score of 12.4%.
| Gold Futures Statistics | SPECULATORS | COMMERCIALS | SMALL TRADERS |
| –% of Open Interest Longs: | 48.5 | 26.5 | 9.0 |
| –% of Open Interest Shorts: | 30.8 | 47.2 | 6.0 |
| – Net Position: | 76,956 | -90,030 | 13,074 |
| – Gross Longs: | 210,890 | 115,073 | 39,286 |
| – Gross Shorts: | 133,934 | 205,103 | 26,212 |
| – Long to Short Ratio: | 1.6 to 1 | 0.6 to 1 | 1.5 to 1 |
| NET POSITION TREND: | |||
| – Strength Index Score (3 Year Range Pct): | 8.2 | 91.4 | 12.4 |
| – Strength Index Reading (3 Year Range): | Bearish-Extreme | Bullish-Extreme | Bearish-Extreme |
| NET POSITION MOVEMENT INDEX: | |||
| – 6-Week Change in Strength Index: | -8.9 | 7.4 | 7.2 |
Silver Comex Futures
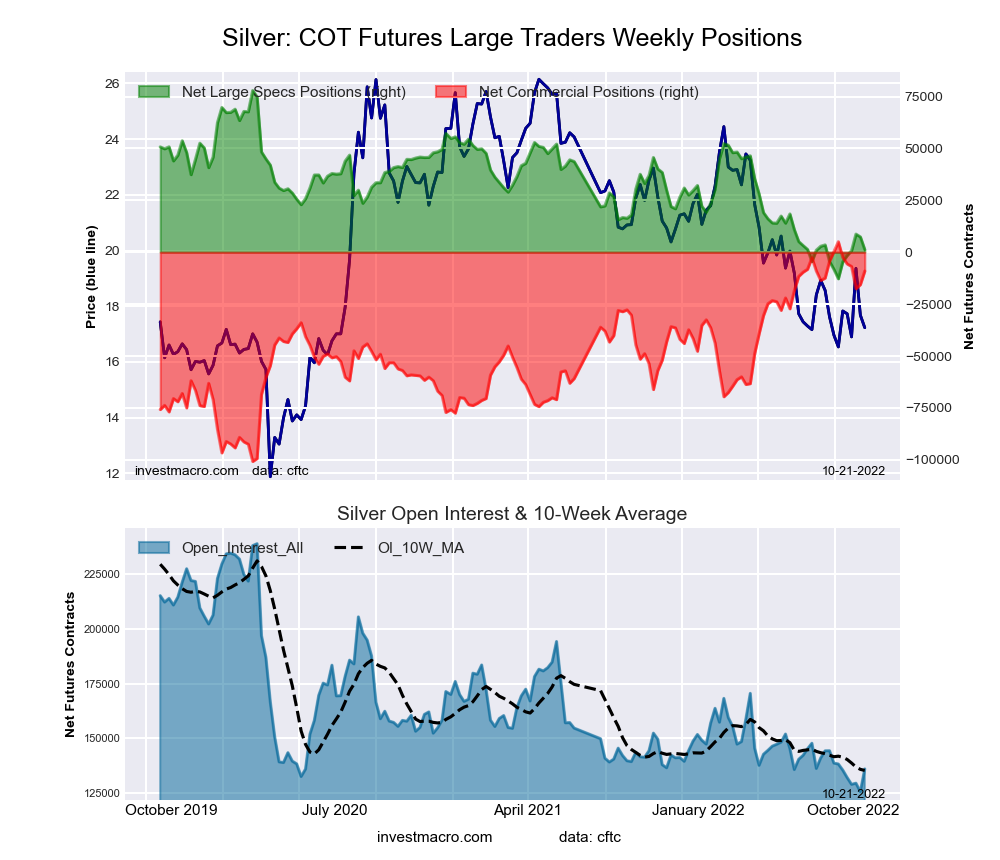
The silver Comex futures large speculator standing this week came in at a net position of 1,267 contracts in the data reported through Tuesday. This was a weekly decline of -6,122 contracts from the previous week, which had a total of 7,389 net contracts.
This week’s current strength score (the trader positioning range over the past three years, measured from 0 to 100) shows the speculators are currently Bearish-Extreme with a score of 15.5%. The commercials are Bullish-Extreme with a score of 86.6% and the small traders (not shown in chart) are Bearish-Extreme with a score of 8.2%.
| Silver Futures Statistics | SPECULATORS | COMMERCIALS | SMALL TRADERS |
| –% of Open Interest Longs: | 37.9 | 37.5 | 16.2 |
| –% of Open Interest Shorts: | 37.0 | 44.1 | 10.4 |
| – Net Position: | 1,267 | -9,085 | 7,818 |
| – Gross Longs: | 51,541 | 50,956 | 22,014 |
| – Gross Shorts: | 50,274 | 60,041 | 14,196 |
| – Long to Short Ratio: | 1.0 to 1 | 0.8 to 1 | 1.6 to 1 |
| NET POSITION TREND: | |||
| – Strength Index Score (3 Year Range Pct): | 15.5 | 86.6 | 8.2 |
| – Strength Index Reading (3 Year Range): | Bearish-Extreme | Bullish-Extreme | Bearish-Extreme |
| NET POSITION MOVEMENT INDEX: | |||
| – 6-Week Change in Strength Index: | 15.5 | -13.4 | 0.4 |
Copper Grade #1 Futures
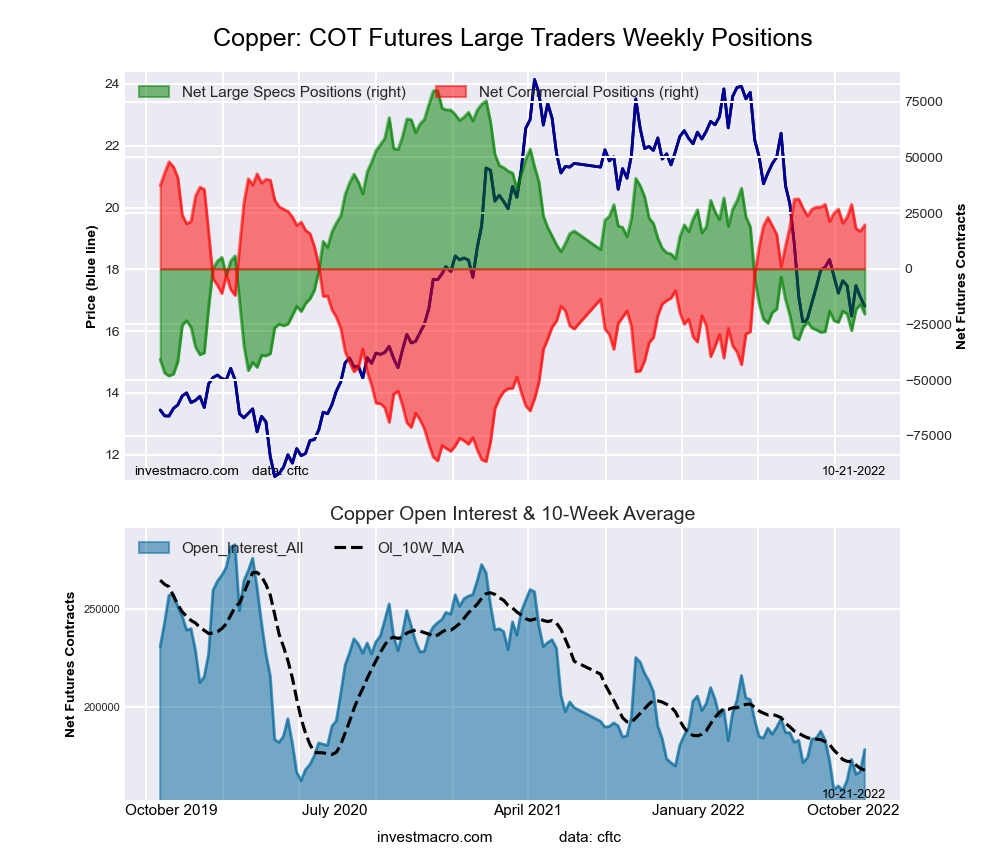
The copper Grade #1 futures large speculator standing this week came in at a net position of -20,302 contracts in the data reported through Tuesday. This was a weekly decline of -4,403 contracts from the previous week, which had a total of -15,899 net contracts.
This week’s current strength score (the trader positioning range over the past three years, measured from 0 to 100) shows the speculators are currently Bearish with a score of 20.2%. The commercials are Bullish-Extreme with a score of 82.3% and the small traders (not shown in chart) are Bearish with a score of 28.8%.
| Copper Futures Statistics | SPECULATORS | COMMERCIALS | SMALL TRADERS |
| –% of Open Interest Longs: | 27.6 | 46.4 | 8.5 |
| –% of Open Interest Shorts: | 39.0 | 35.4 | 8.1 |
| – Net Position: | -20,302 | 19,696 | 606 |
| – Gross Longs: | 49,335 | 82,890 | 15,118 |
| – Gross Shorts: | 69,637 | 63,194 | 14,512 |
| – Long to Short Ratio: | 0.7 to 1 | 1.3 to 1 | 1.0 to 1 |
| NET POSITION TREND: | |||
| – Strength Index Score (3 Year Range Pct): | 20.2 | 82.3 | 28.8 |
| – Strength Index Reading (3 Year Range): | Bearish | Bullish-Extreme | Bearish |
| NET POSITION MOVEMENT INDEX: | |||
| – 6-Week Change in Strength Index: | 2.9 | -5.5 | 19.9 |
Platinum Futures
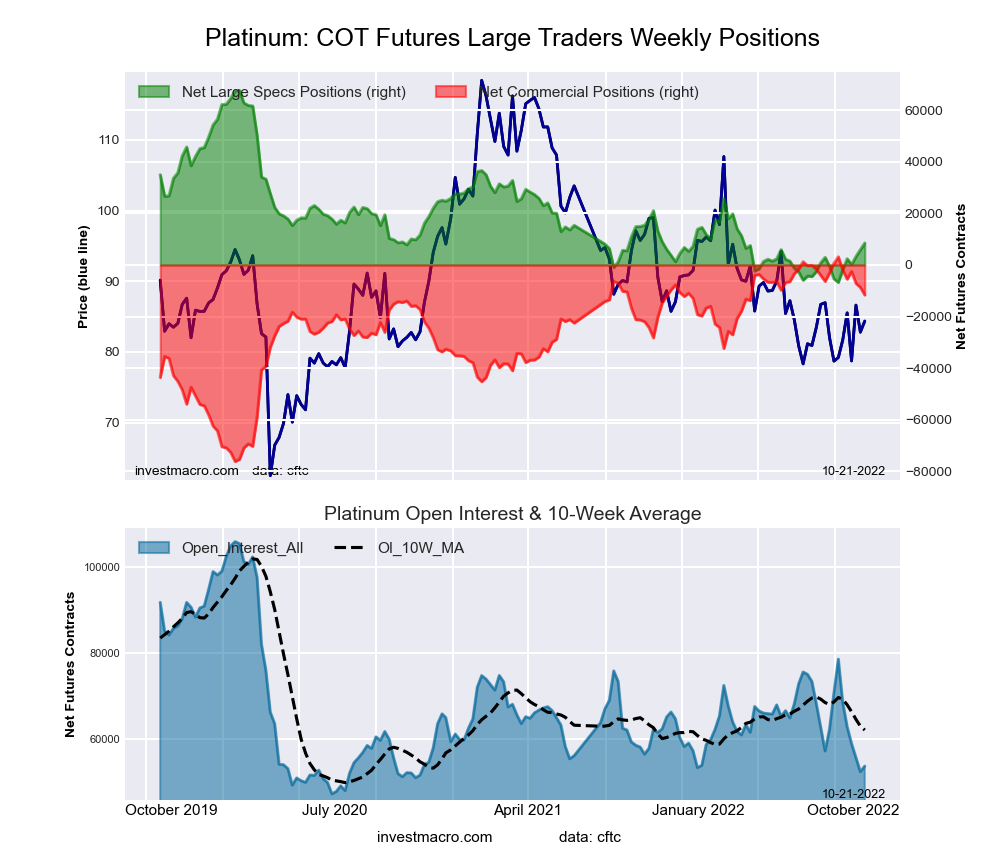
The platinum futures large speculator standing this week came in at a net position of 8,494 contracts in the data reported through Tuesday. This was a weekly gain of 2,566 contracts from the previous week, which had a total of 5,928 net contracts.
This week’s current strength score (the trader positioning range over the past three years, measured from 0 to 100) shows the speculators are currently Bearish with a score of 20.5%. The commercials are Bullish-Extreme with a score of 81.4% and the small traders (not shown in chart) are Bearish-Extreme with a score of 10.3%.
| Platinum Futures Statistics | SPECULATORS | COMMERCIALS | SMALL TRADERS |
| –% of Open Interest Longs: | 49.1 | 36.1 | 12.0 |
| –% of Open Interest Shorts: | 33.3 | 57.8 | 6.1 |
| – Net Position: | 8,494 | -11,632 | 3,138 |
| – Gross Longs: | 26,385 | 19,406 | 6,436 |
| – Gross Shorts: | 17,891 | 31,038 | 3,298 |
| – Long to Short Ratio: | 1.5 to 1 | 0.6 to 1 | 2.0 to 1 |
| NET POSITION TREND: | |||
| – Strength Index Score (3 Year Range Pct): | 20.5 | 81.4 | 10.3 |
| – Strength Index Reading (3 Year Range): | Bearish | Bullish-Extreme | Bearish-Extreme |
| NET POSITION MOVEMENT INDEX: | |||
| – 6-Week Change in Strength Index: | 20.5 | -18.6 | -6.1 |
Palladium Futures
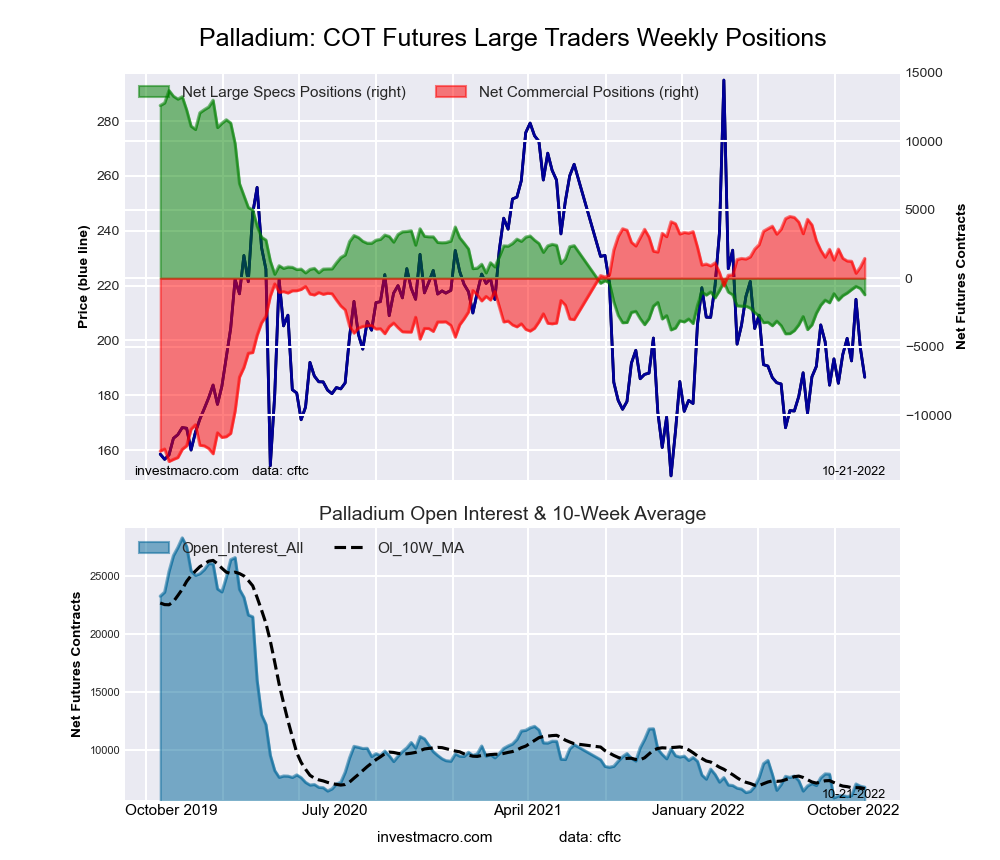
The palladium futures large speculator standing this week came in at a net position of -1,209 contracts in the data reported through Tuesday. This was a weekly fall of -455 contracts from the previous week, which had a total of -754 net contracts.
This week’s current strength score (the trader positioning range over the past three years, measured from 0 to 100) shows the speculators are currently Bearish-Extreme with a score of 16.4%. The commercials are Bullish-Extreme with a score of 82.3% and the small traders (not shown in chart) are Bearish with a score of 30.3%.
| Palladium Futures Statistics | SPECULATORS | COMMERCIALS | SMALL TRADERS |
| –% of Open Interest Longs: | 26.3 | 58.3 | 14.3 |
| –% of Open Interest Shorts: | 44.1 | 37.1 | 17.8 |
| – Net Position: | -1,209 | 1,444 | -235 |
| – Gross Longs: | 1,793 | 3,968 | 975 |
| – Gross Shorts: | 3,002 | 2,524 | 1,210 |
| – Long to Short Ratio: | 0.6 to 1 | 1.6 to 1 | 0.8 to 1 |
| NET POSITION TREND: | |||
| – Strength Index Score (3 Year Range Pct): | 16.4 | 82.3 | 30.3 |
| – Strength Index Reading (3 Year Range): | Bearish-Extreme | Bullish-Extreme | Bearish |
| NET POSITION MOVEMENT INDEX: | |||
| – 6-Week Change in Strength Index: | 2.3 | -4.0 | 16.9 |
Article By InvestMacro – Receive our weekly COT Newsletter.
COT Report: The COT data, released weekly to the public each Friday, is updated through the most recent Tuesday (data is three days old) and shows a quick view of how large speculators or non-commercials (for-profit traders) were positioned in the futures markets.
The CFTC categorizes trader positions according to commercial hedgers (traders who use futures contracts for hedging as part of the business), non-commercials (large traders who speculate to realize trading profits), and non-reportable traders (usually small traders/speculators) as well as their open interest (contracts open in the market at time of reporting). See CFTC criteria here.
More By This Author:
Speculator Extremes: Bitcoin, Nikkei, Ultra 10s & Canadian Dollar Top Bullish & Bearish Positions
COT Metals Speculators Boost Their Gold Bullish Bets 2nd Week
Commodity Currencies (Loonie, Aussie & Kiwi) Lead COT Speculators Bet Changes This Week


Comments
Log in or sign up to join the conversation.