
Here are the latest charts and statistics for the Commitment of Traders (COT) data published by the Commodities Futures Trading Commission (CFTC).
The latest COT data is updated through Tuesday, January 25 and shows a quick view of how large traders (for-profit speculators and commercial entities) were positioned in the futures markets. All currency positions are in direct relation to the US dollar where, for example, a bet for the euro is a bet that the euro will rise versus the dollar while a bet against the euro will be a bet that the euro will decline versus the dollar.
Highlighting the COT currency data was the further gains of bullish bets in the Euro currency futures contracts. Euro speculators raised their bullish bets for a sixth consecutive week this week and for the seventh time in the past eight weeks. Over the last six-week time-frame, Euro bets have improved by a total of +43,439 contracts, going from -11,879 net positions on December 14th to +31,560 net positions this week. This week’s net speculator standing marks the highest level for Euro bets since August 17th, a span of twenty-three weeks.
Joining the Euro (6,976 contracts) with positive changes this week were the yen (12,606 contracts), US Dollar Index (427 contracts), Australian dollar (5,181 contracts), Swiss franc (2,014 contracts), Canadian dollar (4,825 contracts) and Bitcoin (515 contracts).
The currencies with declining bets were the British pound sterling (-7,516 contracts), New Zealand dollar (-2,442 contracts), Brazil real (-1,247 contracts), Russian ruble (-2,478 contracts) and the Mexican peso (-5,710 contracts).
Data Snapshot of Forex Market Traders | Columns Legend
| EUR | 682,952 | 77 | 31,560 | 45 | -56,258 | 60 | 24,698 | 15 |
| JPY | 197,830 | 53 | -68,273 | 25 | 82,863 | 77 | -14,590 | 18 |
| AUD | 190,020 | 75 | -83,273 | 8 | 97,749 | 92 | -14,476 | 17 |
| GBP | 182,040 | 27 | -7,763 | 68 | 16,842 | 40 | -9,079 | 37 |
| MXN | 150,142 | 26 | -790 | 27 | -1,478 | 72 | 2,268 | 53 |
| CAD | 146,448 | 28 | 12,317 | 60 | -19,581 | 44 | 7,264 | 44 |
| NZD | 53,316 | 50 | -10,773 | 53 | 13,281 | 51 | -2,508 | 23 |
| USD Index | 52,328 | 72 | 36,861 | 89 | -42,505 | 4 | 5,644 | 78 |
| RUB | 46,883 | 48 | 3,944 | 23 | -4,288 | 76 | 344 | 44 |
| BRL | 46,657 | 54 | -12,616 | 52 | 11,258 | 48 | 1,358 | 83 |
| CHF | 39,742 | 14 | -8,796 | 55 | 13,479 | 46 | -4,683 | 50 |
| Bitcoin | 11,756 | 64 | -34 | 100 | -478 | 0 | 512 | 25 |
US Dollar Index Futures:
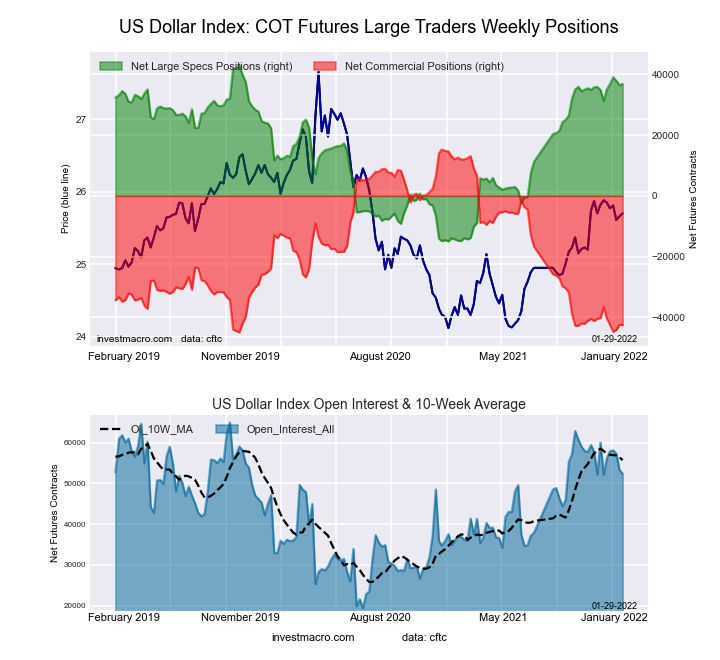
The US Dollar Index large speculator standing this week resulted in a net position of 36,861 contracts in the data reported through Tuesday. This was a weekly rise of 427 contracts from the previous week which had a total of 36,434 net contracts.
This week’s current strength score (the trader positioning range over the past three years, measured from 0 to 100) shows the speculators are currently Bullish-Extreme with a score of 89.4 percent. The commercials are Bearish-Extreme with a score of 4.0 percent and the small traders (not shown in chart) are Bullish with a score of 78.3 percent.
| US DOLLAR INDEX Statistics | SPECULATORS | COMMERCIALS | SMALL TRADERS |
| – Percent of Open Interest Longs: | 79.8 | 3.4 | 14.6 |
| – Percent of Open Interest Shorts: | 9.4 | 84.6 | 3.8 |
| – Net Position: | 36,861 | -42,505 | 5,644 |
| – Gross Longs: | 41,772 | 1,777 | 7,658 |
| – Gross Shorts: | 4,911 | 44,282 | 2,014 |
| – Long to Short Ratio: | 8.5 to 1 | 0.0 to 1 | 3.8 to 1 |
| NET POSITION TREND: | |||
| – Strength Index Score (3 Year Range Pct): | 89.4 | 4.0 | 78.3 |
| – Strength Index Reading (3 Year Range): | Bullish-Extreme | Bearish-Extreme | Bullish |
| NET POSITION MOVEMENT INDEX: | |||
| – 6-Week Change in Strength Index: | 9.7 | -9.8 | 3.0 |
Euro Currency Futures:
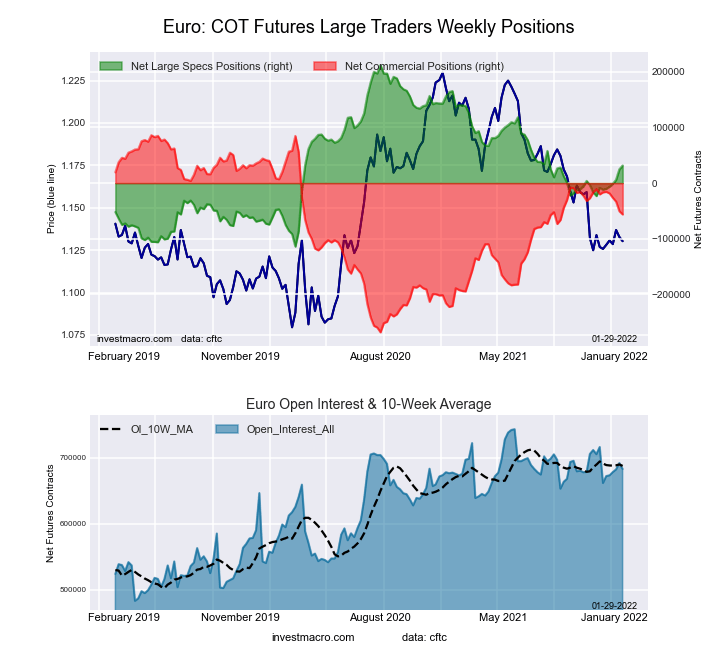
The Euro Currency large speculator standing this week resulted in a net position of 31,560 contracts in the data reported through Tuesday. This was a weekly rise of 6,976 contracts from the previous week which had a total of 24,584 net contracts.
This week’s current strength score (the trader positioning range over the past three years, measured from 0 to 100) shows the speculators are currently Bearish with a score of 44.7 percent. The commercials are Bullish with a score of 59.8 percent and the small traders (not shown in chart) are Bearish-Extreme with a score of 15.3 percent.
| EURO Currency Statistics | SPECULATORS | COMMERCIALS | SMALL TRADERS |
| – Percent of Open Interest Longs: | 31.2 | 55.5 | 11.6 |
| – Percent of Open Interest Shorts: | 26.6 | 63.8 | 8.0 |
| – Net Position: | 31,560 | -56,258 | 24,698 |
| – Gross Longs: | 213,408 | 379,154 | 79,273 |
| – Gross Shorts: | 181,848 | 435,412 | 54,575 |
| – Long to Short Ratio: | 1.2 to 1 | 0.9 to 1 | 1.5 to 1 |
| NET POSITION TREND: | |||
| – Strength Index Score (3 Year Range Pct): | 44.7 | 59.8 | 15.3 |
| – Strength Index Reading (3 Year Range): | Bearish | Bullish | Bearish-Extreme |
| NET POSITION MOVEMENT INDEX: | |||
| – 6-Week Change in Strength Index: | 13.3 | -11.2 | -6.2 |
British Pound Sterling Futures:
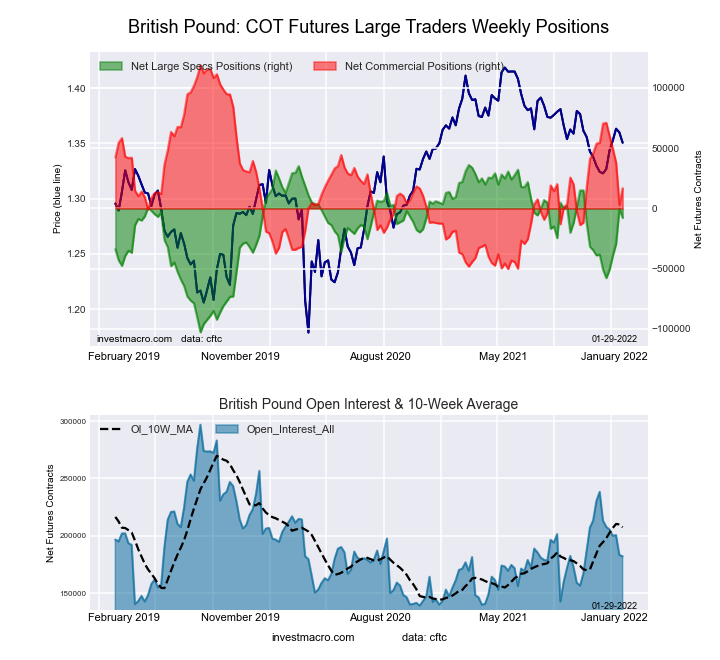
The British Pound Sterling large speculator standing this week resulted in a net position of -7,763 contracts in the data reported through Tuesday. This was a weekly lowering of -7,516 contracts from the previous week which had a total of -247 net contracts.
This week’s current strength score (the trader positioning range over the past three years, measured from 0 to 100) shows the speculators are currently Bullish with a score of 68.4 percent. The commercials are Bearish with a score of 39.6 percent and the small traders (not shown in chart) are Bearish with a score of 36.8 percent.
| BRITISH POUND Statistics | SPECULATORS | COMMERCIALS | SMALL TRADERS |
| – Percent of Open Interest Longs: | 20.1 | 64.7 | 13.7 |
| – Percent of Open Interest Shorts: | 24.4 | 55.5 | 18.7 |
| – Net Position: | -7,763 | 16,842 | -9,079 |
| – Gross Longs: | 36,666 | 117,812 | 24,909 |
| – Gross Shorts: | 44,429 | 100,970 | 33,988 |
| – Long to Short Ratio: | 0.8 to 1 | 1.2 to 1 | 0.7 to 1 |
| NET POSITION TREND: | |||
| – Strength Index Score (3 Year Range Pct): | 68.4 | 39.6 | 36.8 |
| – Strength Index Reading (3 Year Range): | Bullish | Bearish | Bearish |
| NET POSITION MOVEMENT INDEX: | |||
| – 6-Week Change in Strength Index: | 31.0 | -31.7 | 22.0 |
Japanese Yen Futures:
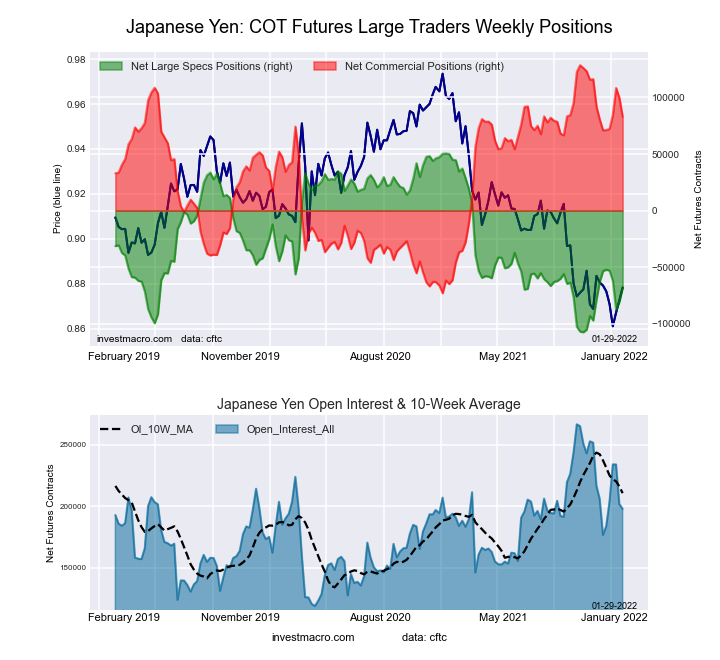
The Japanese Yen large speculator standing this week resulted in a net position of -68,273 contracts in the data reported through Tuesday. This was a weekly advance of 12,606 contracts from the previous week which had a total of -80,879 net contracts.
This week’s current strength score (the trader positioning range over the past three years, measured from 0 to 100) shows the speculators are currently Bearish with a score of 24.9 percent. The commercials are Bullish with a score of 77.3 percent and the small traders (not shown in chart) are Bearish-Extreme with a score of 18.3 percent.
| JAPANESE YEN Statistics | SPECULATORS | COMMERCIALS | SMALL TRADERS |
| – Percent of Open Interest Longs: | 8.0 | 81.0 | 9.1 |
| – Percent of Open Interest Shorts: | 42.5 | 39.1 | 16.4 |
| – Net Position: | -68,273 | 82,863 | -14,590 |
| – Gross Longs: | 15,866 | 160,178 | 17,950 |
| – Gross Shorts: | 84,139 | 77,315 | 32,540 |
| – Long to Short Ratio: | 0.2 to 1 | 2.1 to 1 | 0.6 to 1 |
| NET POSITION TREND: | |||
| – Strength Index Score (3 Year Range Pct): | 24.9 | 77.3 | 18.3 |
| – Strength Index Reading (3 Year Range): | Bearish | Bullish | Bearish-Extreme |
| NET POSITION MOVEMENT INDEX: | |||
| – 6-Week Change in Strength Index: | -9.3 | 5.9 | 6.4 |
Swiss Franc Futures:
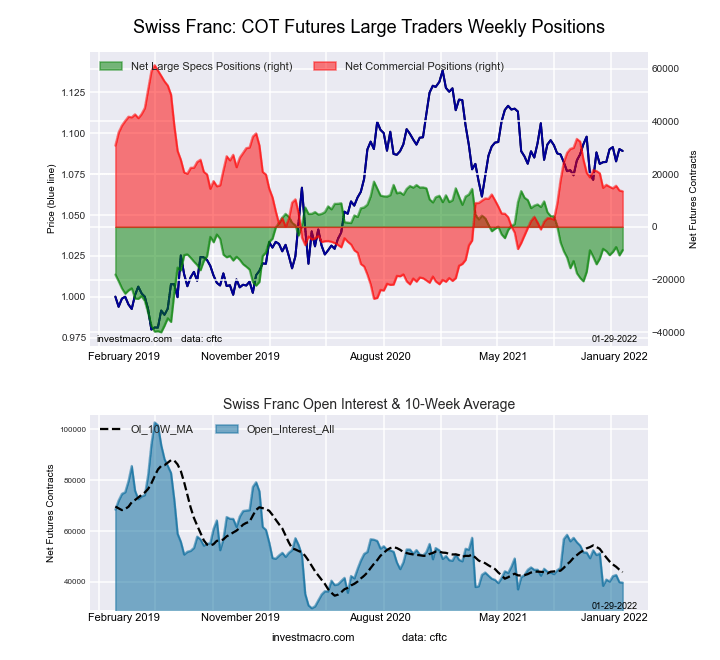
The Swiss Franc large speculator standing this week resulted in a net position of -8,796 contracts in the data reported through Tuesday. This was a weekly gain of 2,014 contracts from the previous week which had a total of -10,810 net contracts.
This week’s current strength score (the trader positioning range over the past three years, measured from 0 to 100) shows the speculators are currently Bullish with a score of 54.6 percent. The commercials are Bearish with a score of 46.0 percent and the small traders (not shown in chart) are Bearish with a score of 49.5 percent.
| SWISS FRANC Statistics | SPECULATORS | COMMERCIALS | SMALL TRADERS |
| – Percent of Open Interest Longs: | 5.0 | 69.4 | 25.2 |
| – Percent of Open Interest Shorts: | 27.2 | 35.5 | 36.9 |
| – Net Position: | -8,796 | 13,479 | -4,683 |
| – Gross Longs: | 1,999 | 27,591 | 9,996 |
| – Gross Shorts: | 10,795 | 14,112 | 14,679 |
| – Long to Short Ratio: | 0.2 to 1 | 2.0 to 1 | 0.7 to 1 |
| NET POSITION TREND: | |||
| – Strength Index Score (3 Year Range Pct): | 54.6 | 46.0 | 49.5 |
| – Strength Index Reading (3 Year Range): | Bullish | Bearish | Bearish |
| NET POSITION MOVEMENT INDEX: | |||
| – 6-Week Change in Strength Index: | -0.8 | -1.5 | 5.2 |
Canadian Dollar Futures:
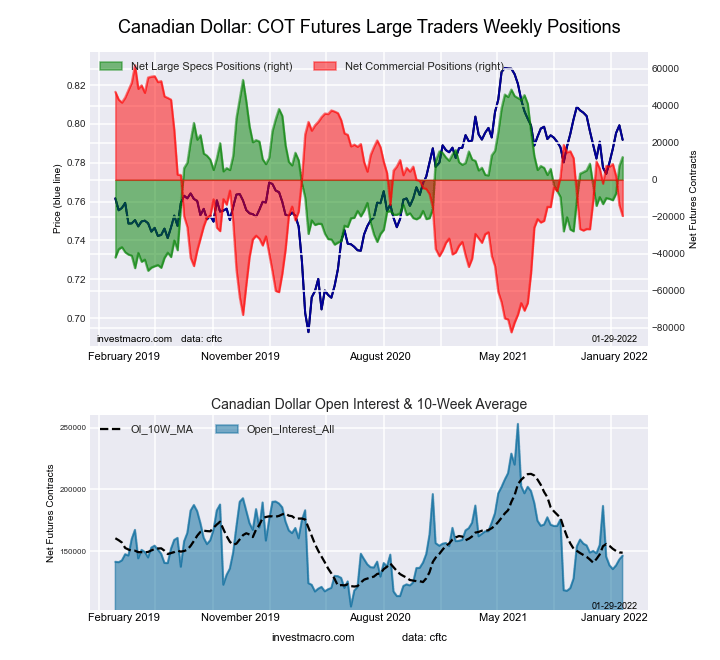
The Canadian Dollar large speculator standing this week resulted in a net position of 12,317 contracts in the data reported through Tuesday. This was a weekly increase of 4,825 contracts from the previous week which had a total of 7,492 net contracts.
This week’s current strength score (the trader positioning range over the past three years, measured from 0 to 100) shows the speculators are currently Bullish with a score of 59.6 percent. The commercials are Bearish with a score of 43.5 percent and the small traders (not shown in chart) are Bearish with a score of 44.2 percent.
| CANADIAN DOLLAR Statistics | SPECULATORS | COMMERCIALS | SMALL TRADERS |
| – Percent of Open Interest Longs: | 36.3 | 39.3 | 21.5 |
| – Percent of Open Interest Shorts: | 27.9 | 52.6 | 16.6 |
| – Net Position: | 12,317 | -19,581 | 7,264 |
| – Gross Longs: | 53,129 | 57,492 | 31,539 |
| – Gross Shorts: | 40,812 | 77,073 | 24,275 |
| – Long to Short Ratio: | 1.3 to 1 | 0.7 to 1 | 1.3 to 1 |
| NET POSITION TREND: | |||
| – Strength Index Score (3 Year Range Pct): | 59.6 | 43.5 | 44.2 |
| – Strength Index Reading (3 Year Range): | Bullish | Bearish | Bearish |
| NET POSITION MOVEMENT INDEX: | |||
| – 6-Week Change in Strength Index: | 24.7 | -12.1 | -15.8 |
Australian Dollar Futures:
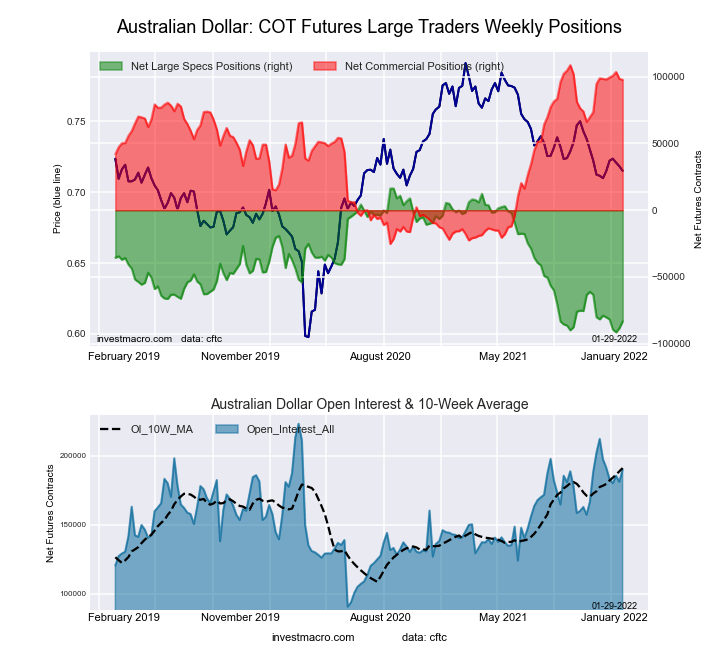
The Australian Dollar large speculator standing this week resulted in a net position of -83,273 contracts in the data reported through Tuesday. This was a weekly rise of 5,181 contracts from the previous week which had a total of -88,454 net contracts.
This week’s current strength score (the trader positioning range over the past three years, measured from 0 to 100) shows the speculators are currently Bearish-Extreme with a score of 7.6 percent. The commercials are Bullish-Extreme with a score of 91.8 percent and the small traders (not shown in chart) are Bearish-Extreme with a score of 17.1 percent.
| AUSTRALIAN DOLLAR Statistics | SPECULATORS | COMMERCIALS | SMALL TRADERS |
| – Percent of Open Interest Longs: | 8.0 | 80.7 | 8.6 |
| – Percent of Open Interest Shorts: | 51.8 | 29.3 | 16.2 |
| – Net Position: | -83,273 | 97,749 | -14,476 |
| – Gross Longs: | 15,121 | 153,386 | 16,371 |
| – Gross Shorts: | 98,394 | 55,637 | 30,847 |
| – Long to Short Ratio: | 0.2 to 1 | 2.8 to 1 | 0.5 to 1 |
| NET POSITION TREND: | |||
| – Strength Index Score (3 Year Range Pct): | 7.6 | 91.8 | 17.1 |
| – Strength Index Reading (3 Year Range): | Bearish-Extreme | Bullish-Extreme | Bearish-Extreme |
| NET POSITION MOVEMENT INDEX: | |||
| – 6-Week Change in Strength Index: | -4.1 | -0.5 | 12.3 |
New Zealand Dollar Futures:
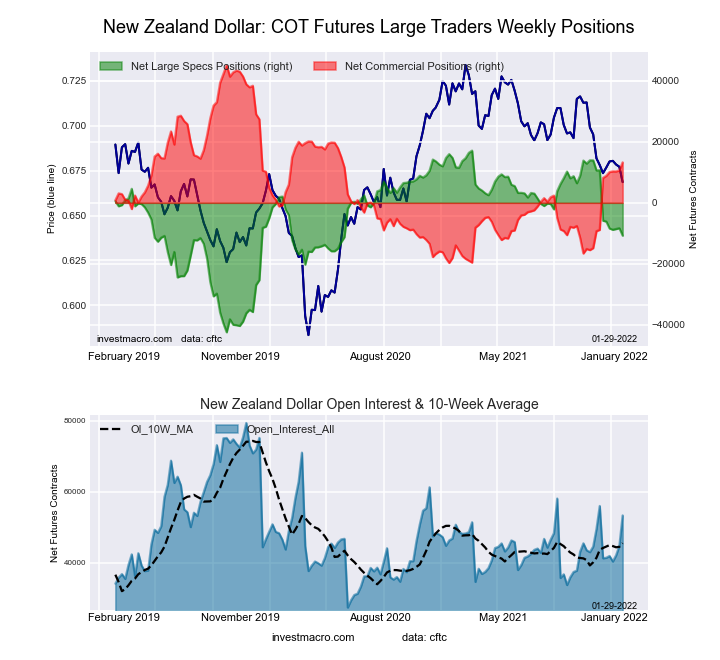
The New Zealand Dollar large speculator standing this week resulted in a net position of -10,773 contracts in the data reported through Tuesday. This was a weekly decline of -2,442 contracts from the previous week which had a total of -8,331 net contracts.
This week’s current strength score (the trader positioning range over the past three years, measured from 0 to 100) shows the speculators are currently Bullish with a score of 53.2 percent. The commercials are Bullish with a score of 50.9 percent and the small traders (not shown in chart) are Bearish with a score of 23.1 percent.
| NEW ZEALAND DOLLAR Statistics | SPECULATORS | COMMERCIALS | SMALL TRADERS |
| – Percent of Open Interest Longs: | 29.9 | 63.2 | 5.2 |
| – Percent of Open Interest Shorts: | 50.1 | 38.3 | 9.9 |
| – Net Position: | -10,773 | 13,281 | -2,508 |
| – Gross Longs: | 15,948 | 33,712 | 2,784 |
| – Gross Shorts: | 26,721 | 20,431 | 5,292 |
| – Long to Short Ratio: | 0.6 to 1 | 1.7 to 1 | 0.5 to 1 |
| NET POSITION TREND: | |||
| – Strength Index Score (3 Year Range Pct): | 53.2 | 50.9 | 23.1 |
| – Strength Index Reading (3 Year Range): | Bullish | Bullish | Bearish |
| NET POSITION MOVEMENT INDEX: | |||
| – 6-Week Change in Strength Index: | -8.2 | 7.9 | -2.2 |
Mexican Peso Futures:
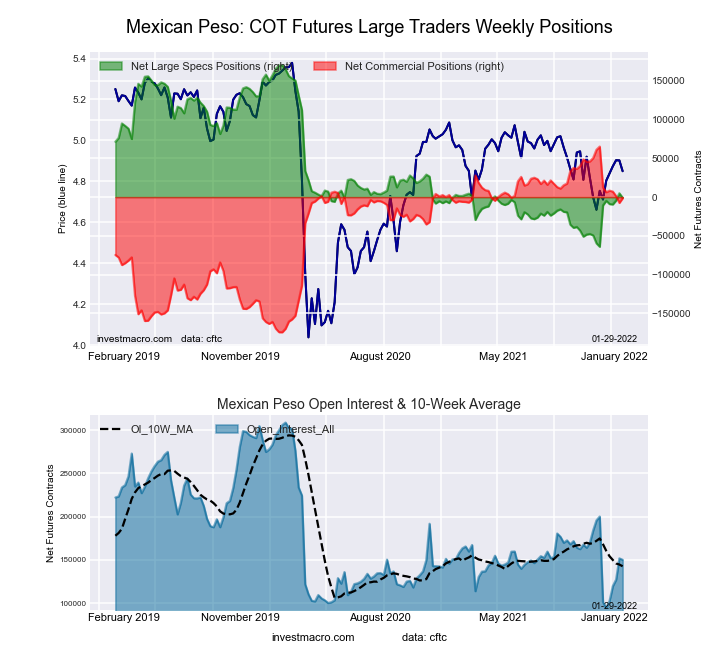
The Mexican Peso large speculator standing this week resulted in a net position of -790 contracts in the data reported through Tuesday. This was a weekly decrease of -5,710 contracts from the previous week which had a total of 4,920 net contracts.
This week’s current strength score (the trader positioning range over the past three years, measured from 0 to 100) shows the speculators are currently Bearish with a score of 27.0 percent. The commercials are Bullish with a score of 72.2 percent and the small traders (not shown in chart) are Bullish with a score of 52.6 percent.
| MEXICAN PESO Statistics | SPECULATORS | COMMERCIALS | SMALL TRADERS |
| – Percent of Open Interest Longs: | 44.3 | 51.6 | 3.9 |
| – Percent of Open Interest Shorts: | 44.8 | 52.6 | 2.4 |
| – Net Position: | -790 | -1,478 | 2,268 |
| – Gross Longs: | 66,449 | 77,473 | 5,892 |
| – Gross Shorts: | 67,239 | 78,951 | 3,624 |
| – Long to Short Ratio: | 1.0 to 1 | 1.0 to 1 | 1.6 to 1 |
| NET POSITION TREND: | |||
| – Strength Index Score (3 Year Range Pct): | 27.0 | 72.2 | 52.6 |
| – Strength Index Reading (3 Year Range): | Bearish | Bullish | Bullish |
| NET POSITION MOVEMENT INDEX: | |||
| – 6-Week Change in Strength Index: | 4.2 | -5.8 | 17.0 |
Brazilian Real Futures:
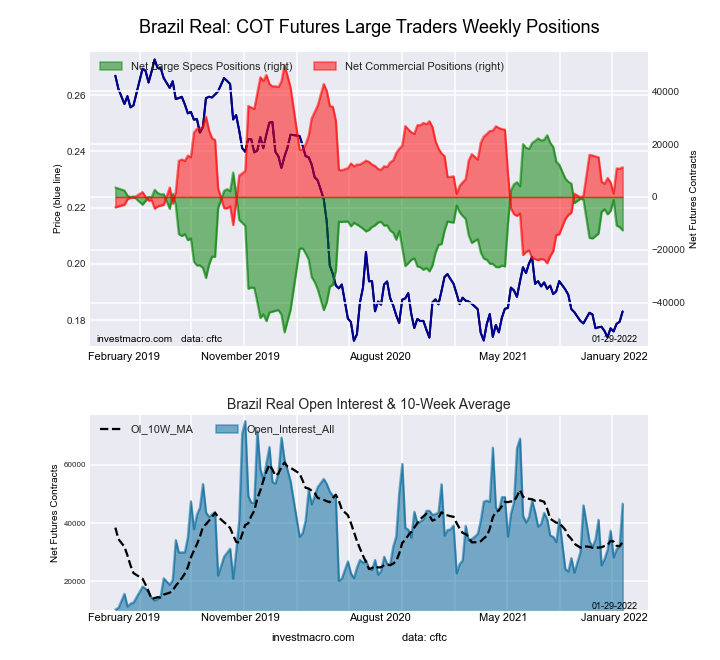
The Brazilian Real large speculator standing this week resulted in a net position of -12,616 contracts in the data reported through Tuesday. This was a weekly lowering of -1,247 contracts from the previous week which had a total of -11,369 net contracts.
This week’s current strength score (the trader positioning range over the past three years, measured from 0 to 100) shows the speculators are currently Bullish with a score of 51.7 percent. The commercials are Bearish with a score of 48.4 percent and the small traders (not shown in chart) are Bullish-Extreme with a score of 83.2 percent.
| BRAZIL REAL Statistics | SPECULATORS | COMMERCIALS | SMALL TRADERS |
| – Percent of Open Interest Longs: | 45.9 | 45.6 | 7.6 |
| – Percent of Open Interest Shorts: | 73.0 | 21.5 | 4.7 |
| – Net Position: | -12,616 | 11,258 | 1,358 |
| – Gross Longs: | 21,434 | 21,274 | 3,541 |
| – Gross Shorts: | 34,050 | 10,016 | 2,183 |
| – Long to Short Ratio: | 0.6 to 1 | 2.1 to 1 | 1.6 to 1 |
| NET POSITION TREND: | |||
| – Strength Index Score (3 Year Range Pct): | 51.7 | 48.4 | 83.2 |
| – Strength Index Reading (3 Year Range): | Bullish | Bearish | Bullish-Extreme |
| NET POSITION MOVEMENT INDEX: | |||
| – 6-Week Change in Strength Index: | -10.7 | 8.4 | 21.0 |
Russian Ruble Futures:
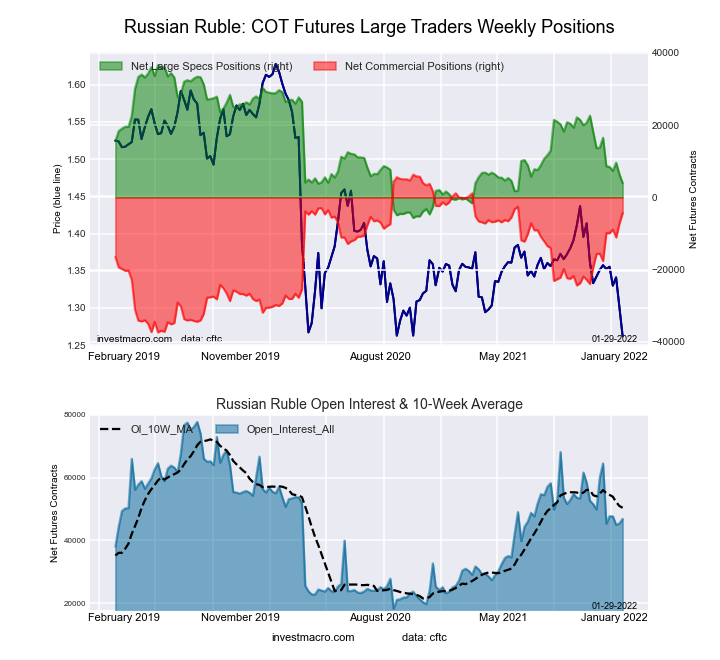
The Russian Ruble large speculator standing this week resulted in a net position of 3,944 contracts in the data reported through Tuesday. This was a weekly decrease of -2,478 contracts from the previous week which had a total of 6,422 net contracts.
This week’s current strength score (the trader positioning range over the past three years, measured from 0 to 100) shows the speculators are currently Bearish with a score of 22.7 percent. The commercials are Bullish with a score of 75.7 percent and the small traders (not shown in chart) are Bearish with a score of 43.9 percent.
| RUSSIAN RUBLE Statistics | SPECULATORS | COMMERCIALS | SMALL TRADERS |
| – Percent of Open Interest Longs: | 32.4 | 63.3 | 4.3 |
| – Percent of Open Interest Shorts: | 24.0 | 72.4 | 3.6 |
| – Net Position: | 3,944 | -4,288 | 344 |
| – Gross Longs: | 15,179 | 29,669 | 2,015 |
| – Gross Shorts: | 11,235 | 33,957 | 1,671 |
| – Long to Short Ratio: | 1.4 to 1 | 0.9 to 1 | 1.2 to 1 |
| NET POSITION TREND: | |||
| – Strength Index Score (3 Year Range Pct): | 22.7 | 75.7 | 43.9 |
| – Strength Index Reading (3 Year Range): | Bearish | Bullish | Bearish |
| NET POSITION MOVEMENT INDEX: | |||
| – 6-Week Change in Strength Index: | -29.8 | 30.5 | -20.0 |
Bitcoin Futures:
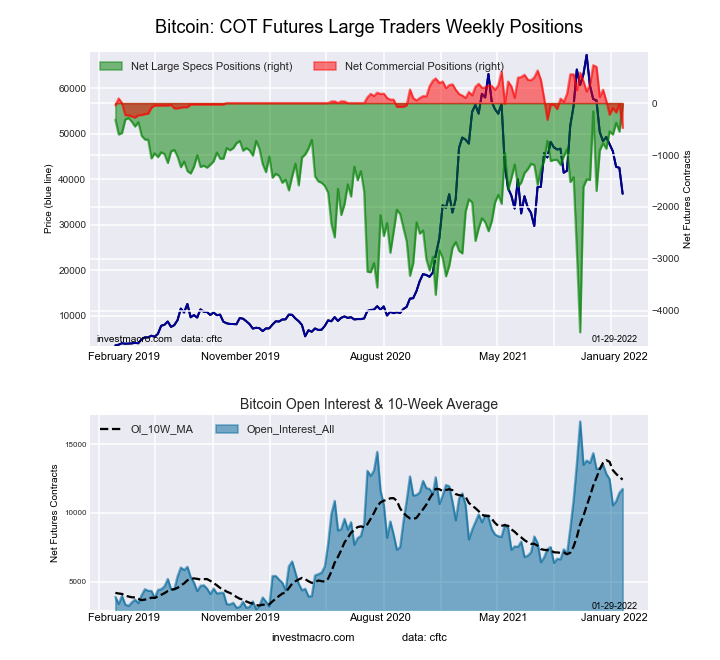
The Bitcoin large speculator standing this week resulted in a net position of -34 contracts in the data reported through Tuesday. This was a weekly boost of 515 contracts from the previous week which had a total of -549 net contracts.
This week’s current strength score (the trader positioning range over the past three years, measured from 0 to 100) shows the speculators are currently Bullish-Extreme with a score of 100.0 percent. The commercials are Bearish-Extreme with a score of 0.0 percent and the small traders (not shown in chart) are Bearish with a score of 24.6 percent.
| BITCOIN Statistics | SPECULATORS | COMMERCIALS | SMALL TRADERS |
| – Percent of Open Interest Longs: | 73.8 | 2.4 | 12.5 |
| – Percent of Open Interest Shorts: | 74.1 | 6.5 | 8.1 |
| – Net Position: | -34 | -478 | 512 |
| – Gross Longs: | 8,678 | 285 | 1,469 |
| – Gross Shorts: | 8,712 | 763 | 957 |
| – Long to Short Ratio: | 1.0 to 1 | 0.4 to 1 | 1.5 to 1 |
| NET POSITION TREND: | |||
| – Strength Index Score (3 Year Range Pct): | 100.0 | 0.0 | 24.6 |
| – Strength Index Reading (3 Year Range): | Bullish-Extreme | Bearish-Extreme | Bearish |
| NET POSITION MOVEMENT INDEX: | |||
| – 6-Week Change in Strength Index: | 16.9 | -60.9 | -0.1 |
*COT Report: The COT data, released weekly to the public each Friday, is updated through the most recent Tuesday (data is 3 days old) and shows a quick view of how large speculators or non-commercials (for-profit traders) were positioned in the futures markets.
The CFTC categorizes trader positions according to commercial hedgers (traders who use futures contracts for hedging as part of the business), non-commercials (large traders who speculate to realize trading profits) and nonreportable traders (usually small traders/speculators) as well as their open interest (contracts open in the market at time of reporting).See CFTC criteria here.


Comments
Log in or sign up to join the conversation.