
Here are the latest charts and statistics for the Commitment of Traders (COT) data published by the Commodities Futures Trading Commission (CFTC).

The latest COT data is updated through Tuesday January 18th and shows a quick view of how large traders (for-profit speculators and commercial entities) were positioned in the futures markets.
Highlighting the COT energy data is the renewed bullishness in the WTI Crude Oil futures bets over the past two weeks. The speculative net position in the WTI Crude Oil futures has jumped by over +25,000 contracts in each of the past two weeks (two-week total gain of +52,956 contracts) following eight straight weeks of declining speculator bets previously. This renewed push higher has brought the overall speculator bullish standing to its best level of the past seven weeks. The jump in WTI bets has coincided with a rise in the WTI Crude Oil prices that have reached their best levels since 2014 around the $87 per barrel threshold.
Joining WTI Crude Oil (25,276 contracts) in rising this week were Natural Gas (4,517 contracts), Gasoline (1,287 contracts) and the Bloomberg Commodity Index (5,328 contracts).
The energy markets with lower speculator bets this week were Brent Crude Oil (-3,515 contracts) and Heating Oil (-1,048 contracts).
Data Snapshot of Commodity Market Traders | Columns Legend
| WTI Crude | 2,059,564 | 29 | 385,781 | 32 | -427,052 | 59 | 41,271 | 73 |
| Corn | 1,487,858 | 19 | 388,138 | 80 | -342,687 | 23 | -45,451 | 17 |
| Natural Gas | 1,169,188 | 14 | -118,047 | 43 | 86,174 | 58 | 31,873 | 60 |
| Sugar | 882,598 | 13 | 113,168 | 60 | -127,053 | 44 | 13,885 | 25 |
| Soybeans | 692,022 | 20 | 128,015 | 62 | -92,198 | 44 | -35,817 | 12 |
| Gold | 539,204 | 30 | 194,207 | 50 | -221,068 | 50 | 26,861 | 40 |
| Wheat | 378,456 | 23 | 4,840 | 51 | 5,160 | 46 | -10,000 | 54 |
| Heating Oil | 367,686 | 42 | 14,827 | 64 | -39,935 | 29 | 25,108 | 85 |
| Coffee | 264,394 | 32 | 63,784 | 95 | -66,937 | 7 | 3,153 | 10 |
| Brent | 227,413 | 61 | -20,206 | 84 | 17,211 | 18 | 2,995 | 50 |
| Copper | 203,198 | 29 | 22,310 | 58 | -30,538 | 38 | 8,228 | 73 |
| Silver | 148,737 | 15 | 29,700 | 52 | -41,540 | 58 | 11,840 | 12 |
| Platinum | 57,321 | 17 | 7,229 | 13 | -12,911 | 91 | 5,682 | 41 |
| Palladium | 9,372 | 13 | -3,309 | 3 | 3,409 | 96 | -100 | 39 |
WTI Crude Oil Futures:
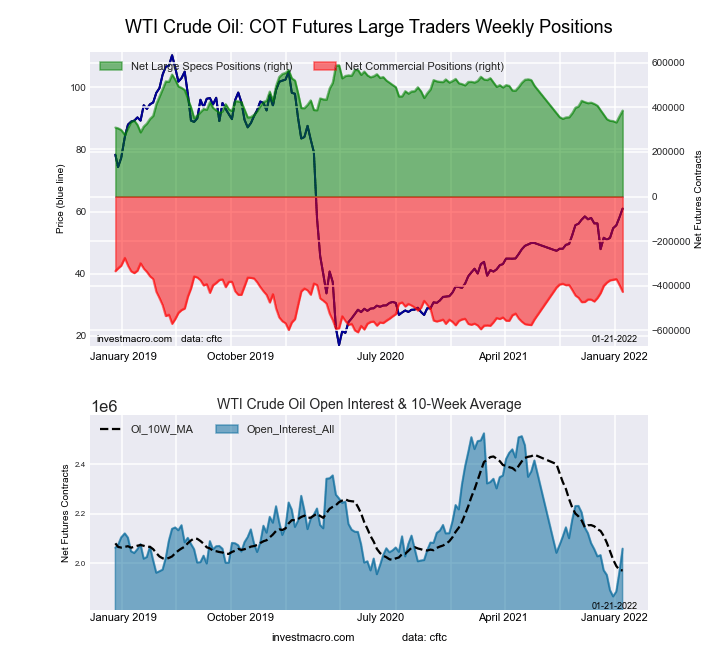
The WTI Crude Oil Futures large speculator standing this week equaled a net position of 385,781 contracts in the data reported through Tuesday. This was a weekly advance of 25,276 contracts from the previous week which had a total of 360,505 net contracts.
This week’s current strength score (the trader positioning range over the past three years, measured from 0 to 100) shows the speculators are currently Bearish with a score of 32.4 percent. The commercials are Bullish with a score of 58.6 percent and the small traders (not shown in chart) are Bullish with a score of 73.2 percent.
| WTI Crude Oil Futures Statistics | SPECULATORS | COMMERCIALS | SMALL TRADERS |
| – Percent of Open Interest Longs: | 24.4 | 36.9 | 5.0 |
| – Percent of Open Interest Shorts: | 5.7 | 57.6 | 3.0 |
| – Net Position: | 385,781 | -427,052 | 41,271 |
| – Gross Longs: | 503,178 | 759,825 | 102,689 |
| – Gross Shorts: | 117,397 | 1,186,877 | 61,418 |
| – Long to Short Ratio: | 4.3 to 1 | 0.6 to 1 | 1.7 to 1 |
| NET POSITION TREND: | |||
| – Strength Index Score (3 Year Range Pct): | 32.4 | 58.6 | 73.2 |
| – Strength Index Reading (3 Year Range): | Bearish | Bullish | Bullish |
| NET POSITION MOVEMENT INDEX: | |||
| – 6-Week Change in Strength Index: | 6.2 | -8.6 | 11.4 |
Brent Crude Oil Futures:
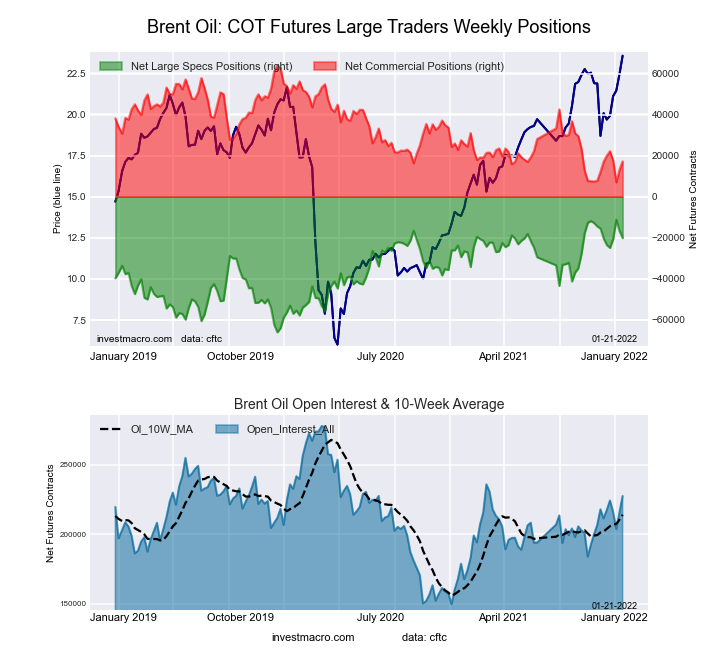
The Brent Crude Oil Futures large speculator standing this week equaled a net position of -20,206 contracts in the data reported through Tuesday. This was a weekly reduction of -3,515 contracts from the previous week which had a total of -16,691 net contracts.
This week’s current strength score (the trader positioning range over the past three years, measured from 0 to 100) shows the speculators are currently Bullish-Extreme with a score of 83.7 percent. The commercials are Bearish-Extreme with a score of 17.9 percent and the small traders (not shown in chart) are Bearish with a score of 49.7 percent.
| Brent Crude Oil Futures Statistics | SPECULATORS | COMMERCIALS | SMALL TRADERS |
| – Percent of Open Interest Longs: | 18.6 | 42.7 | 3.6 |
| – Percent of Open Interest Shorts: | 27.5 | 35.2 | 2.3 |
| – Net Position: | -20,206 | 17,211 | 2,995 |
| – Gross Longs: | 42,379 | 97,204 | 8,286 |
| – Gross Shorts: | 62,585 | 79,993 | 5,291 |
| – Long to Short Ratio: | 0.7 to 1 | 1.2 to 1 | 1.6 to 1 |
| NET POSITION TREND: | |||
| – Strength Index Score (3 Year Range Pct): | 83.7 | 17.9 | 49.7 |
| – Strength Index Reading (3 Year Range): | Bullish-Extreme | Bearish-Extreme | Bearish |
| NET POSITION MOVEMENT INDEX: | |||
| – 6-Week Change in Strength Index: | 0.4 | 0.2 | -4.7 |
Natural Gas Futures:
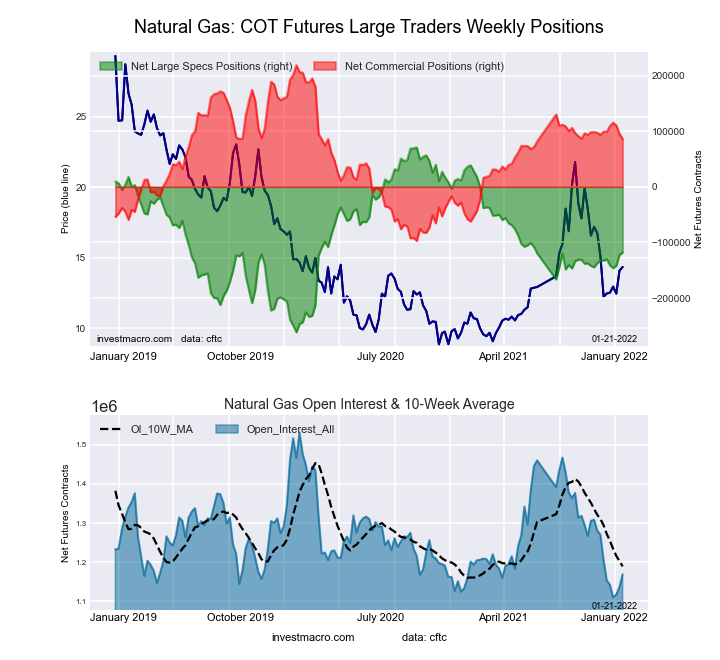
The Natural Gas Futures large speculator standing this week equaled a net position of -118,047 contracts in the data reported through Tuesday. This was a weekly lift of 4,517 contracts from the previous week which had a total of -122,564 net contracts.
This week’s current strength score (the trader positioning range over the past three years, measured from 0 to 100) shows the speculators are currently Bearish with a score of 43.2 percent. The commercials are Bullish with a score of 58.0 percent and the small traders (not shown in chart) are Bullish with a score of 59.7 percent.
| Natural Gas Futures Statistics | SPECULATORS | COMMERCIALS | SMALL TRADERS |
| – Percent of Open Interest Longs: | 20.3 | 41.5 | 4.8 |
| – Percent of Open Interest Shorts: | 30.4 | 34.2 | 2.1 |
| – Net Position: | -118,047 | 86,174 | 31,873 |
| – Gross Longs: | 237,851 | 485,729 | 56,405 |
| – Gross Shorts: | 355,898 | 399,555 | 24,532 |
| – Long to Short Ratio: | 0.7 to 1 | 1.2 to 1 | 2.3 to 1 |
| NET POSITION TREND: | |||
| – Strength Index Score (3 Year Range Pct): | 43.2 | 58.0 | 59.7 |
| – Strength Index Reading (3 Year Range): | Bearish | Bullish | Bullish |
| NET POSITION MOVEMENT INDEX: | |||
| – 6-Week Change in Strength Index: | 4.3 | -4.2 | -3.0 |
Gasoline Blendstock Futures:
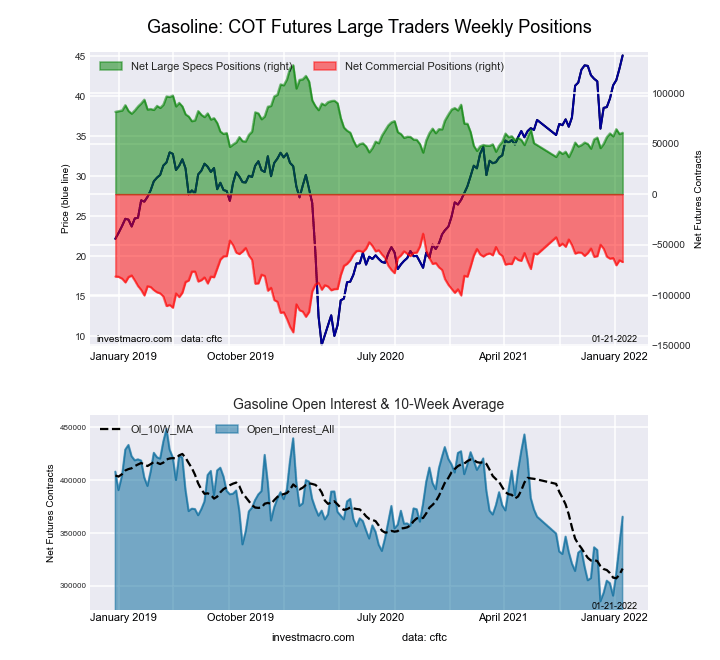
The Gasoline Blendstock Futures large speculator standing this week equaled a net position of 60,789 contracts in the data reported through Tuesday. This was a weekly gain of 1,287 contracts from the previous week which had a total of 59,502 net contracts.
This week’s current strength score (the trader positioning range over the past three years, measured from 0 to 100) shows the speculators are currently Bearish with a score of 32.0 percent. The commercials are Bullish with a score of 69.7 percent and the small traders (not shown in chart) are Bullish with a score of 50.2 percent.
| Nasdaq Mini Futures Statistics | SPECULATORS | COMMERCIALS | SMALL TRADERS |
| – Percent of Open Interest Longs: | 29.0 | 49.0 | 6.2 |
| – Percent of Open Interest Shorts: | 12.4 | 67.4 | 4.5 |
| – Net Position: | 60,789 | -67,265 | 6,476 |
| – Gross Longs: | 105,959 | 179,287 | 22,808 |
| – Gross Shorts: | 45,170 | 246,552 | 16,332 |
| – Long to Short Ratio: | 2.3 to 1 | 0.7 to 1 | 1.4 to 1 |
| NET POSITION TREND: | |||
| – Strength Index Score (3 Year Range Pct): | 32.0 | 69.7 | 50.2 |
| – Strength Index Reading (3 Year Range): | Bearish | Bullish | Bullish |
| NET POSITION MOVEMENT INDEX: | |||
| – 6-Week Change in Strength Index: | 11.1 | -13.2 | 13.6 |
#2 Heating Oil NY-Harbor Futures:
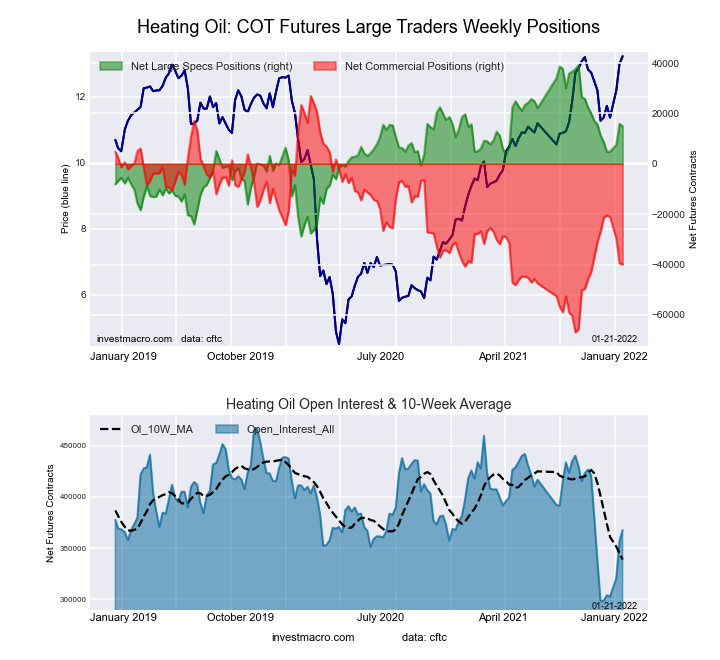
The #2 Heating Oil NY-Harbor Futures large speculator standing this week equaled a net position of 14,827 contracts in the data reported through Tuesday. This was a weekly lowering of -1,048 contracts from the previous week which had a total of 15,875 net contracts.
This week’s current strength score (the trader positioning range over the past three years, measured from 0 to 100) shows the speculators are currently Bullish with a score of 64.2 percent. The commercials are Bearish with a score of 28.7 percent and the small traders (not shown in chart) are Bullish-Extreme with a score of 85.3 percent.
| Heating Oil Futures Statistics | SPECULATORS | COMMERCIALS | SMALL TRADERS |
| – Percent of Open Interest Longs: | 16.3 | 50.5 | 13.9 |
| – Percent of Open Interest Shorts: | 12.2 | 61.4 | 7.1 |
| – Net Position: | 14,827 | -39,935 | 25,108 |
| – Gross Longs: | 59,763 | 185,764 | 51,279 |
| – Gross Shorts: | 44,936 | 225,699 | 26,171 |
| – Long to Short Ratio: | 1.3 to 1 | 0.8 to 1 | 2.0 to 1 |
| NET POSITION TREND: | |||
| – Strength Index Score (3 Year Range Pct): | 64.2 | 28.7 | 85.3 |
| – Strength Index Reading (3 Year Range): | Bullish | Bearish | Bullish-Extreme |
| NET POSITION MOVEMENT INDEX: | |||
| – 6-Week Change in Strength Index: | 9.2 | -19.8 | 42.8 |
Bloomberg Commodity Index Futures:
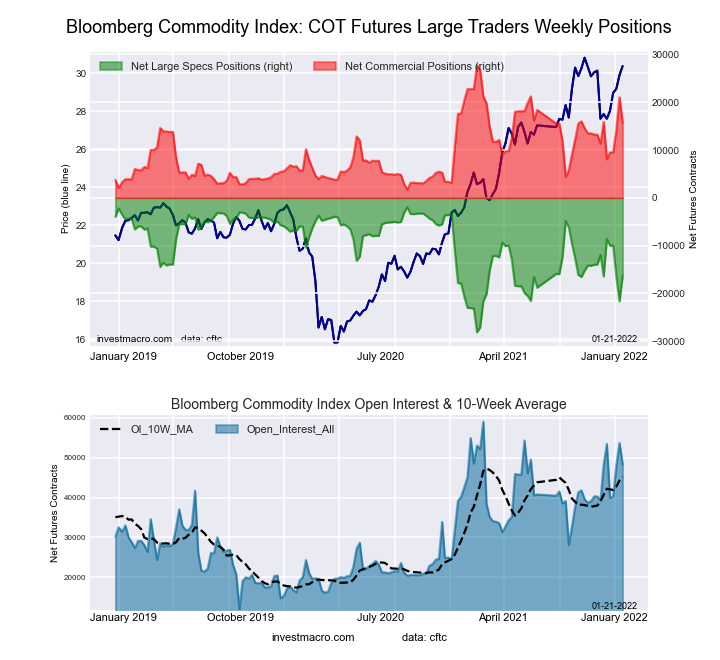
The Bloomberg Commodity Index Futures large speculator standing this week equaled a net position of -16,277 contracts in the data reported through Tuesday. This was a weekly boost of 5,328 contracts from the previous week which had a total of -21,605 net contracts.
This week’s current strength score (the trader positioning range over the past three years, measured from 0 to 100) shows the speculators are currently Bearish with a score of 45.2 percent. The commercials are Bullish with a score of 53.7 percent and the small traders (not shown in chart) are Bearish with a score of 39.7 percent.
| Bloomberg Index Futures Statistics | SPECULATORS | COMMERCIALS | SMALL TRADERS |
| – Percent of Open Interest Longs: | 62.6 | 33.8 | 1.2 |
| – Percent of Open Interest Shorts: | 96.3 | 1.2 | 0.1 |
| – Net Position: | -16,277 | 15,708 | 569 |
| – Gross Longs: | 30,232 | 16,308 | 595 |
| – Gross Shorts: | 46,509 | 600 | 26 |
| – Long to Short Ratio: | 0.7 to 1 | 27.2 to 1 | 22.9 to 1 |
| NET POSITION TREND: | |||
| – Strength Index Score (3 Year Range Pct): | 45.2 | 53.7 | 39.7 |
| – Strength Index Reading (3 Year Range): | Bearish | Bullish | Bearish |
| NET POSITION MOVEMENT INDEX: | |||
| – 6-Week Change in Strength Index: | 0.6 | -0.6 | 0.5 |
*COT Report: The COT data, released weekly to the public each Friday, is updated through the most recent Tuesday (data is 3 days old) and shows a quick view of how large speculators or non-commercials (for-profit traders) were positioned in the futures markets.
The CFTC categorizes trader positions according to commercial hedgers (traders who use futures contracts for hedging as part of the business), non-commercials (large traders who speculate to realize trading profits) and nonreportable traders (usually small traders/speculators) as well as their open interest (contracts open in the market at time of reporting).See CFTC criteria here.


Comments
Log in or sign up to join the conversation.