
Here are the latest charts and statistics for the Commitment of Traders (COT) data published by the Commodities Futures Trading Commission (CFTC). The latest COT data is updated through Tuesday, December 14th, 2021 and shows a quick view of how large traders (for-profit speculators and commercial entities) were positioned in the futures markets.
Highlighting this week’s COT bonds data is the continued strengthening of the speculators net positions in the 2-Year Bond futures. Speculator net positions have increased in 2-year bonds for the third straight week and for the ninth time out of the past eleven weeks. The net speculator position turned bullish on November 30th after spending fourteen straight weeks in bearish territory and has now climbed to the most bullish level of the past one-hundred and eighty-five weeks, dating all the way back to May 29th of 2018. At the moment, both the speculators (+45,198 contracts) and commercials (+26,586 contracts) are bullish on the 2-year futures while the small traders make up the other side of the contracts with bearish positioning with a total of -71,784 contracts.
Joining the 2-Year Bond (12,593 contracts) with rising bets this week were the Long US Bond (9,204 contracts), the FedFunds (24,007 contracts) and the 5-Year (47,728 contracts) while decreasing bets for the week were seen in the Eurodollar (-347,668 contracts), 10-Year (-6,850 contracts), Ultra 10-Year (-5,586 contracts) and the Ultra US Bond (-2,119 contracts).
Data Snapshot of Bond Market Traders | Columns Legend
| Eurodollar | 11,179,135 | 48 | -1,722,531 | 8 | 2,176,288 | 91 | -453,757 | 17 |
| 10-Year | 3,769,585 | 48 | -273,856 | 30 | 532,167 | 88 | -258,311 | 19 |
| 5-Year | 3,603,997 | 27 | -339,803 | 21 | 567,090 | 91 | -227,287 | 19 |
| 2-Year | 1,965,142 | 7 | 45,198 | 100 | 26,586 | 26 | -71,784 | 0 |
| FedFunds | 1,331,096 | 26 | -89,312 | 29 | 102,121 | 72 | -12,809 | 30 |
| Long T-Bond | 1,219,698 | 52 | -37,318 | 80 | -4,833 | 19 | 42,151 | 86 |
3-Month Eurodollars Futures:
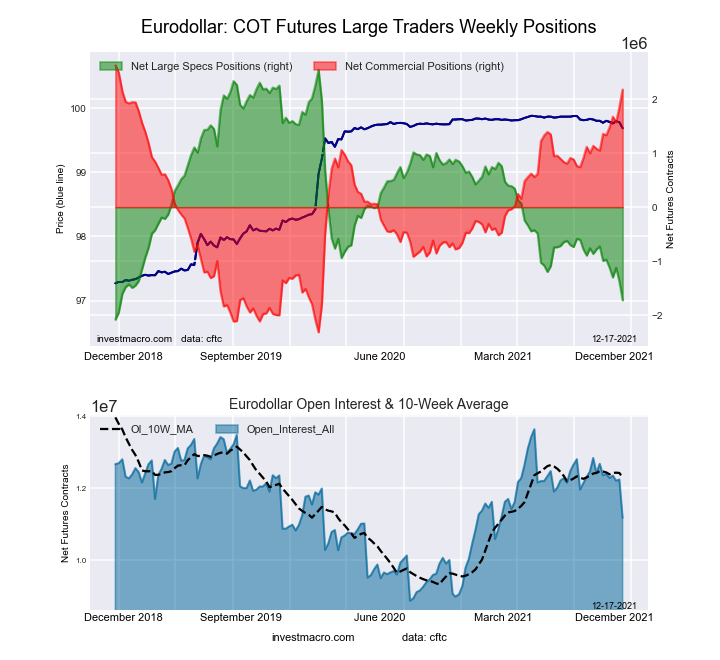
The 3-Month Eurodollars large speculator standing this week equaled a net position of -1,722,531 contracts in the data reported through Tuesday. This was a weekly decrease of -347,668 contracts from the previous week which had a total of -1,374,863 net contracts.
This week’s current strength score (the trader positioning range over the past three years, measured from 0 to 100) shows the speculators are currently Bearish-Extreme with a score of 7.8 percent. The commercials are Bullish-Extreme with a score of 90.9 percent and the small traders (not shown in chart) are Bearish-Extreme with a score of 17.2 percent.
| 3-Month Eurodollars Statistics | SPECULATORS | COMMERCIALS | SMALL TRADERS |
| – Percent of Open Interest Longs: | 8.7 | 69.8 | 4.1 |
| – Percent of Open Interest Shorts: | 24.1 | 50.4 | 8.2 |
| – Net Position: | -1,722,531 | 2,176,288 | -453,757 |
| – Gross Longs: | 974,044 | 7,805,730 | 457,991 |
| – Gross Shorts: | 2,696,575 | 5,629,442 | 911,748 |
| – Long to Short Ratio: | 0.4 to 1 | 1.4 to 1 | 0.5 to 1 |
| NET POSITION TREND: | |||
| – Strength Index Score (3 Year Range Pct): | 7.8 | 90.9 | 17.2 |
| – Strength Index Reading (3 Year Range): | Bearish-Extreme | Bullish-Extreme | Bearish-Extreme |
| NET POSITION MOVEMENT INDEX: | |||
| – 6-Week Change in Strength Index: | -15.8 | 16.6 | -17.5 |
30-Day Federal Funds Futures:
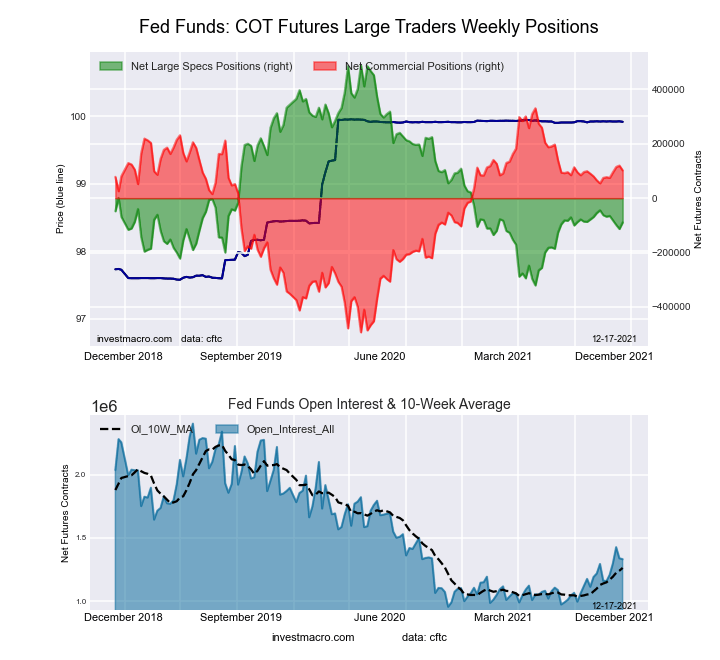
The 30-Day Federal Funds large speculator standing this week equaled a net position of -89,312 contracts in the data reported through Tuesday. This was a weekly increase of 24,007 contracts from the previous week which had a total of -113,319 net contracts.
This week’s current strength score (the trader positioning range over the past three years, measured from 0 to 100) shows the speculators are currently Bearish with a score of 28.6 percent. The commercials are Bullish with a score of 72.3 percent and the small traders (not shown in chart) are Bearish with a score of 29.8 percent.
| 30-Day Federal Funds Statistics | SPECULATORS | COMMERCIALS | SMALL TRADERS |
| – Percent of Open Interest Longs: | 3.7 | 80.9 | 1.7 |
| – Percent of Open Interest Shorts: | 10.4 | 73.2 | 2.6 |
| – Net Position: | -89,312 | 102,121 | -12,809 |
| – Gross Longs: | 48,959 | 1,076,381 | 22,103 |
| – Gross Shorts: | 138,271 | 974,260 | 34,912 |
| – Long to Short Ratio: | 0.4 to 1 | 1.1 to 1 | 0.6 to 1 |
| NET POSITION TREND: | |||
| – Strength Index Score (3 Year Range Pct): | 28.6 | 72.3 | 29.8 |
| – Strength Index Reading (3 Year Range): | Bearish | Bullish | Bearish |
| NET POSITION MOVEMENT INDEX: | |||
| – 6-Week Change in Strength Index: | -3.3 | 3.4 | -2.6 |
2-Year Treasury Note Futures:
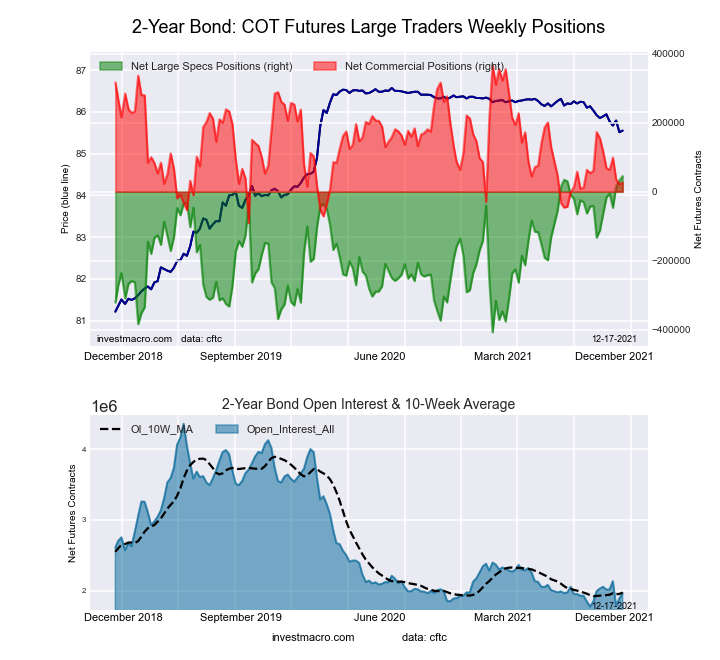
The 2-Year Treasury Note large speculator standing this week equaled a net position of 45,198 contracts in the data reported through Tuesday. This was a weekly rise of 12,593 contracts from the previous week which had a total of 32,605 net contracts.
This week’s current strength score (the trader positioning range over the past three years, measured from 0 to 100) shows the speculators are currently Bullish-Extreme with a score of 100.0 percent. The commercials are Bearish with a score of 25.6 percent and the small traders (not shown in chart) are Bearish-Extreme with a score of 0.0 percent.
| 2-Year Treasury Note Statistics | SPECULATORS | COMMERCIALS | SMALL TRADERS |
| – Percent of Open Interest Longs: | 19.9 | 68.2 | 6.1 |
| – Percent of Open Interest Shorts: | 17.6 | 66.9 | 9.8 |
| – Net Position: | 45,198 | 26,586 | -71,784 |
| – Gross Longs: | 392,000 | 1,340,821 | 120,776 |
| – Gross Shorts: | 346,802 | 1,314,235 | 192,560 |
| – Long to Short Ratio: | 1.1 to 1 | 1.0 to 1 | 0.6 to 1 |
| NET POSITION TREND: | |||
| – Strength Index Score (3 Year Range Pct): | 100.0 | 25.6 | 0.0 |
| – Strength Index Reading (3 Year Range): | Bullish-Extreme | Bearish | Bearish-Extreme |
| NET POSITION MOVEMENT INDEX: | |||
| – 6-Week Change in Strength Index: | 23.9 | -19.6 | -9.5 |
5-Year Treasury Note Futures:
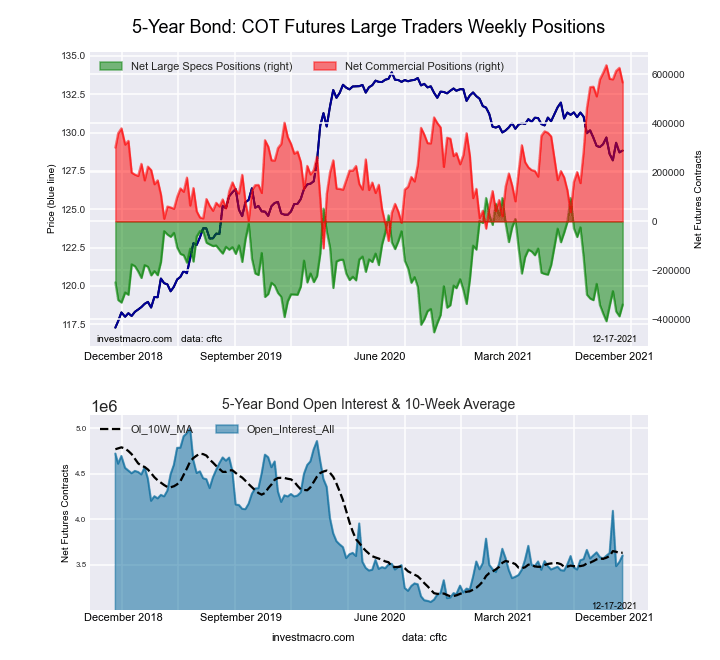
The 5-Year Treasury Note large speculator standing this week equaled a net position of -339,803 contracts in the data reported through Tuesday. This was a weekly boost of 47,728 contracts from the previous week which had a total of -387,531 net contracts.
This week’s current strength score (the trader positioning range over the past three years, measured from 0 to 100) shows the speculators are currently Bearish with a score of 20.6 percent. The commercials are Bullish-Extreme with a score of 90.6 percent and the small traders (not shown in chart) are Bearish-Extreme with a score of 18.6 percent.
| 5-Year Treasury Note Statistics | SPECULATORS | COMMERCIALS | SMALL TRADERS |
| – Percent of Open Interest Longs: | 8.2 | 81.3 | 7.3 |
| – Percent of Open Interest Shorts: | 17.7 | 65.5 | 13.6 |
| – Net Position: | -339,803 | 567,090 | -227,287 |
| – Gross Longs: | 297,042 | 2,928,739 | 262,001 |
| – Gross Shorts: | 636,845 | 2,361,649 | 489,288 |
| – Long to Short Ratio: | 0.5 to 1 | 1.2 to 1 | 0.5 to 1 |
| NET POSITION TREND: | |||
| – Strength Index Score (3 Year Range Pct): | 20.6 | 90.6 | 18.6 |
| – Strength Index Reading (3 Year Range): | Bearish | Bullish-Extreme | Bearish-Extreme |
| NET POSITION MOVEMENT INDEX: | |||
| – 6-Week Change in Strength Index: | 6.7 | -5.3 | 0.8 |
10-Year Treasury Note Futures:
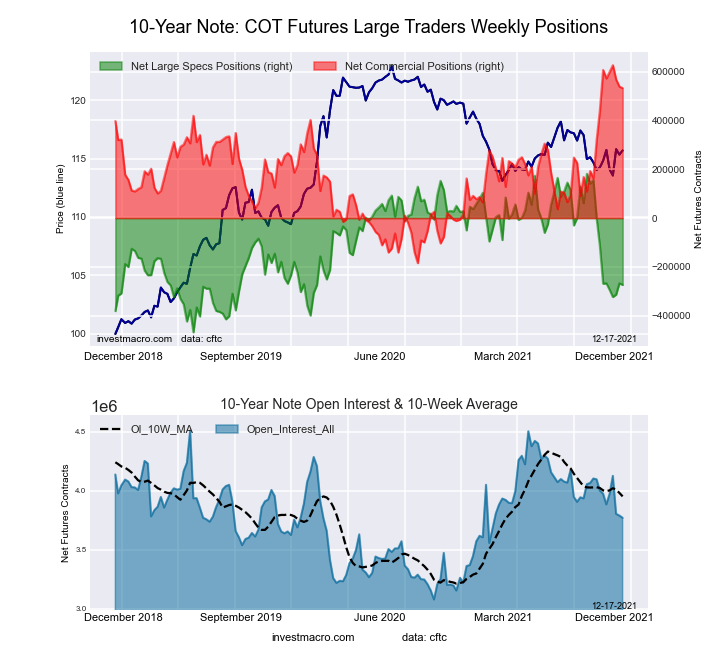
The 10-Year Treasury Note large speculator standing this week equaled a net position of -273,856 contracts in the data reported through Tuesday. This was a weekly decline of -6,850 contracts from the previous week which had a total of -267,006 net contracts.
This week’s current strength score (the trader positioning range over the past three years, measured from 0 to 100) shows the speculators are currently Bearish with a score of 29.9 percent. The commercials are Bullish-Extreme with a score of 88.4 percent and the small traders (not shown in chart) are Bearish-Extreme with a score of 18.5 percent.
| 10-Year Treasury Note Statistics | SPECULATORS | COMMERCIALS | SMALL TRADERS |
| – Percent of Open Interest Longs: | 11.5 | 78.2 | 7.9 |
| – Percent of Open Interest Shorts: | 18.7 | 64.1 | 14.8 |
| – Net Position: | -273,856 | 532,167 | -258,311 |
| – Gross Longs: | 432,501 | 2,946,901 | 298,285 |
| – Gross Shorts: | 706,357 | 2,414,734 | 556,596 |
| – Long to Short Ratio: | 0.6 to 1 | 1.2 to 1 | 0.5 to 1 |
| NET POSITION TREND: | |||
| – Strength Index Score (3 Year Range Pct): | 29.9 | 88.4 | 18.5 |
| – Strength Index Reading (3 Year Range): | Bearish | Bullish-Extreme | Bearish-Extreme |
| NET POSITION MOVEMENT INDEX: | |||
| – 6-Week Change in Strength Index: | -0.8 | -9.2 | 18.5 |
Ultra 10-Year Notes Futures:
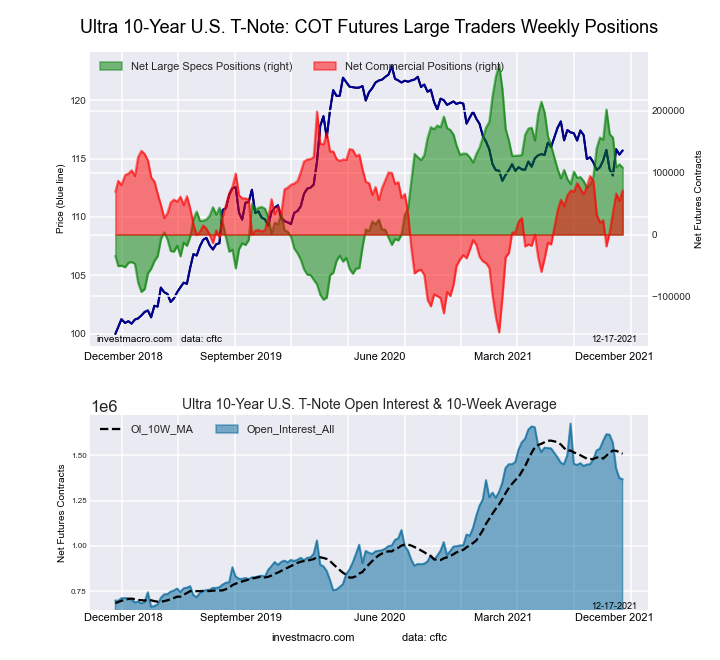
The Ultra 10-Year Notes large speculator standing this week equaled a net position of 108,021 contracts in the data reported through Tuesday. This was a weekly fall of -5,586 contracts from the previous week which had a total of 113,607 net contracts.
This week’s current strength score (the trader positioning range over the past three years, measured from 0 to 100) shows the speculators are currently Bullish with a score of 56.3 percent. The commercials are Bullish with a score of 64.2 percent and the small traders (not shown in chart) are Bearish-Extreme with a score of 7.6 percent.
| Ultra 10-Year Notes Statistics | SPECULATORS | COMMERCIALS | SMALL TRADERS |
| – Percent of Open Interest Longs: | 18.8 | 72.2 | 7.6 |
| – Percent of Open Interest Shorts: | 10.9 | 67.0 | 20.7 |
| – Net Position: | 108,021 | 71,231 | -179,252 |
| – Gross Longs: | 257,314 | 987,498 | 103,827 |
| – Gross Shorts: | 149,293 | 916,267 | 283,079 |
| – Long to Short Ratio: | 1.7 to 1 | 1.1 to 1 | 0.4 to 1 |
| NET POSITION TREND: | |||
| – Strength Index Score (3 Year Range Pct): | 56.3 | 64.2 | 7.6 |
| – Strength Index Reading (3 Year Range): | Bullish | Bullish | Bearish-Extreme |
| NET POSITION MOVEMENT INDEX: | |||
| – 6-Week Change in Strength Index: | -12.0 | 13.5 | -1.5 |
US Treasury Bonds Futures:
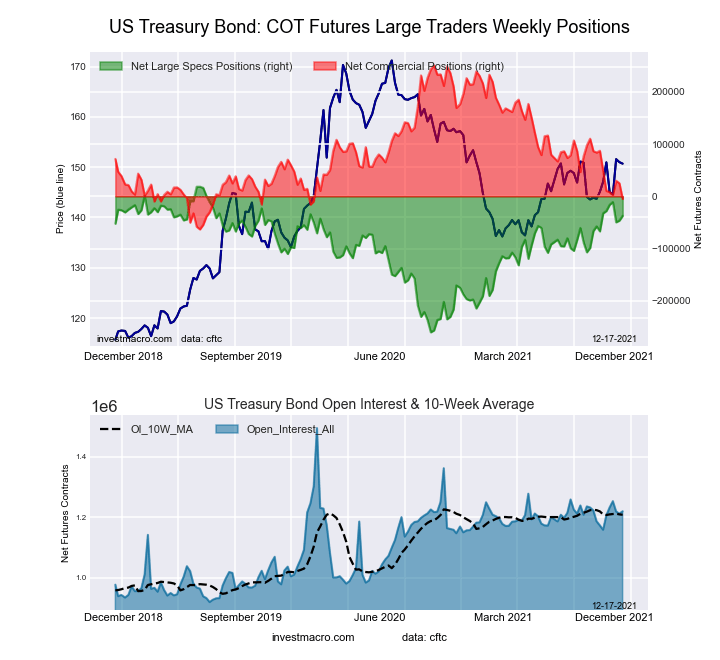
The US Treasury Bonds large speculator standing this week equaled a net position of -37,318 contracts in the data reported through Tuesday. This was a weekly lift of 9,204 contracts from the previous week which had a total of -46,522 net contracts.
This week’s current strength score (the trader positioning range over the past three years, measured from 0 to 100) shows the speculators are currently Bullish-Extreme with a score of 80.0 percent. The commercials are Bearish-Extreme with a score of 18.6 percent and the small traders (not shown in chart) are Bullish-Extreme with a score of 86.0 percent.
| US Treasury Bonds Statistics | SPECULATORS | COMMERCIALS | SMALL TRADERS |
| – Percent of Open Interest Longs: | 11.9 | 70.6 | 15.8 |
| – Percent of Open Interest Shorts: | 15.0 | 71.0 | 12.4 |
| – Net Position: | -37,318 | -4,833 | 42,151 |
| – Gross Longs: | 145,491 | 861,405 | 193,198 |
| – Gross Shorts: | 182,809 | 866,238 | 151,047 |
| – Long to Short Ratio: | 0.8 to 1 | 1.0 to 1 | 1.3 to 1 |
| NET POSITION TREND: | |||
| – Strength Index Score (3 Year Range Pct): | 80.0 | 18.6 | 86.0 |
| – Strength Index Reading (3 Year Range): | Bullish-Extreme | Bearish-Extreme | Bullish-Extreme |
| NET POSITION MOVEMENT INDEX: | |||
| – 6-Week Change in Strength Index: | -1.7 | -17.0 | 46.1 |
Ultra US Treasury Bonds Futures:
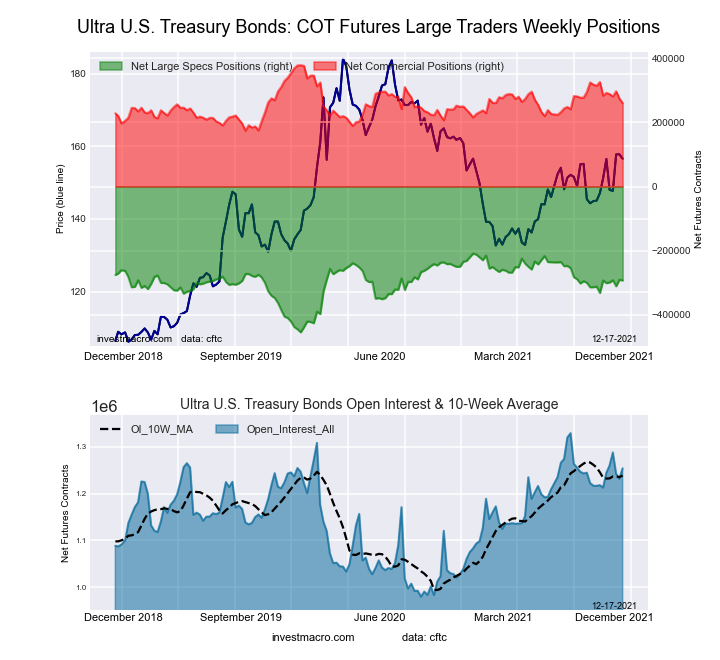
The Ultra US Treasury Bonds large speculator standing this week equaled a net position of -292,473 contracts in the data reported through Tuesday. This was a weekly fall of -2,119 contracts from the previous week which had a total of -290,354 net contracts.
This week’s current strength score (the trader positioning range over the past three years, measured from 0 to 100) shows the speculators are currently Bullish with a score of 65.9 percent. The commercials are Bearish with a score of 42.0 percent and the small traders (not shown in chart) are Bullish with a score of 51.8 percent.
| Ultra US Treasury Bonds Statistics | SPECULATORS | COMMERCIALS | SMALL TRADERS |
| – Percent of Open Interest Longs: | 7.0 | 79.5 | 12.4 |
| – Percent of Open Interest Shorts: | 30.3 | 58.8 | 9.8 |
| – Net Position: | -292,473 | 259,703 | 32,770 |
| – Gross Longs: | 87,778 | 997,164 | 155,563 |
| – Gross Shorts: | 380,251 | 737,461 | 122,793 |
| – Long to Short Ratio: | 0.2 to 1 | 1.4 to 1 | 1.3 to 1 |
| NET POSITION TREND: | |||
| – Strength Index Score (3 Year Range Pct): | 65.9 | 42.0 | 51.8 |
| – Strength Index Reading (3 Year Range): | Bullish | Bearish | Bullish |
| NET POSITION MOVEMENT INDEX: | |||
| – 6-Week Change in Strength Index: | 0.1 | -11.6 | 16.8 |
*COT Report: The COT data, released weekly to the public each Friday, is updated through the most recent Tuesday (data is 3 days old) and shows a quick view of how large speculators or non-commercials (for-profit traders) were positioned in the futures markets.
The CFTC categorizes trader positions according to commercial hedgers (traders who use futures contracts for hedging as part of the business), non-commercials (large traders who speculate to realize trading profits) and nonreportable traders (usually small traders/speculators) as well as their open interest (contracts open in the market at time of reporting).See CFTC criteria here.


Comments
Log in or sign up to join the conversation.