China’s 3Q GDP Beat Should Keep Growth Target In Striking Distance

Source: Shutterstock
China's activity monitor
(Click on image to enlarge)
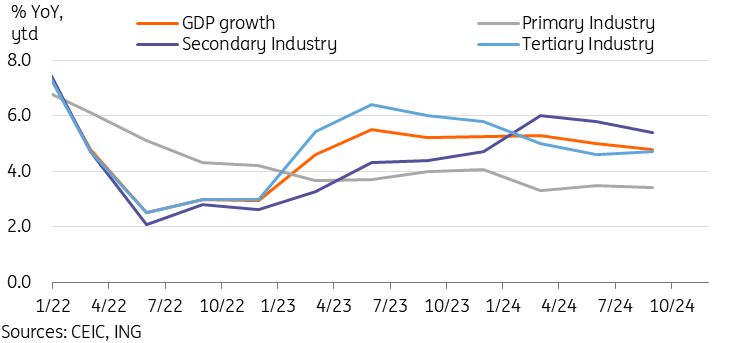
China's third quarter GDP growth edged down but beat forecasts
China's GDP growth slowed in the third quarter, decelerating to 4.6% YoY from 4.7% YoY, but fared better than both our and consensus forecasts, in part due to a stronger-than-expected rebound of September data. The GDP deflator continued to be quite supportive over the last quarter, adding 0.56 ppt to real GDP growth from the nominal GDP numbers.
We saw the contribution from manufacturing slow in the third quarter's growth, down to 5.2% YoY in 3Q24 from 6.5% YoY in 1H24. As a result, the secondary industry's growth rate also dropped to 4.6% YoY from 5.8% YoY in 1H24. An uptick in services to 4.8% YoY from 4.6% YoY in 1H24 helped blunt the impact of slowing manufacturing.
With the third quarter data now in the books, China's GDP growth is now at 4.8% YoY through the first three quarters of the year. The beat in the third quarter numbers keeps China within striking distance to hit its full-year growth target of "around 5%" this year and requires a slightly less impressive 4Q growth rate than what was previously expected.
China's third quarter GDP supported by uptick in services
Property market stabilisation remains elusive
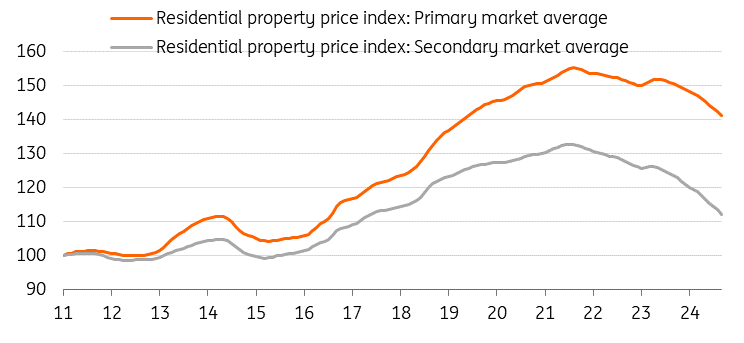
The property market unsurprisingly remains the biggest drag on China's growth. Through the first three quarters of the year, property investment registered growth of -10.1% YoY, while new housing starts were down -12.2% YoY. As we have mentioned in previous reports, new investment is unlikely to see a substantive recovery until prices stabilise and housing inventories decline back toward normal levels; this will continue to take some time and until then property will remain a notable headwind to growth.
The NBS's 70-city housing prices data was also published ahead of the main data. September saw a very marginally slower pace of decline but does not appear to offer much for those looking for signs of stabilisation. New home prices fell by -0.71% MoM and used home prices fell by -0.93% MoM, versus -0.73% MoM and -0.95% MoM respectively in August.
Breaking down the 70-city sample, for the new home market, 66 out of 70 cities continued to see falling new home prices, Nanjing saw unchanged prices, and 3 cities (Shanghai, Taiyuan, and Xuzhou) showed a slight price increase. Silver linings are difficult to find, but the positive sign was that one less city saw a price decline than in August, and Shanghai's upward trend in the new home market appears to be firming up.
In the secondary market, every city in the 70-city sample saw a sequential decline in September. Tier 1 cities mostly saw a steeper decline in September, with Beijing (-1.3%), Shanghai (-1.2%), Shenzhen (-1.3%), and Guangzhou (-1.1%) all down over 1%.
From the 2021 peak, there has now been a 9.0% decline in new home prices and a 15.5% drop in secondary market prices. Policymakers have recently highlighted "halting the real estate decline and spurring a stable recovery" as a recent priority. While the post-stimulus equity market rallies were certainly a welcome sight, stabilising real estate remains more important toward turning around the negative wealth effect's drag on consumption given its larger representation in household balance sheets.
At this stage, most purchase restrictions have been lifted, and falling mortgage rates should make home purchases more attractive at the margin, but we may need to see how significant the measures announced to soak up excess supply through SOE and local government purchases will be. The impact of recent policy moves remains uncertain, but buyers remain cautious at this juncture, and it looks like restoring confidence to prospective homebuyers will remain an uphill climb as the impact from years of tight policy continues to linger.
Property price declines continued in September
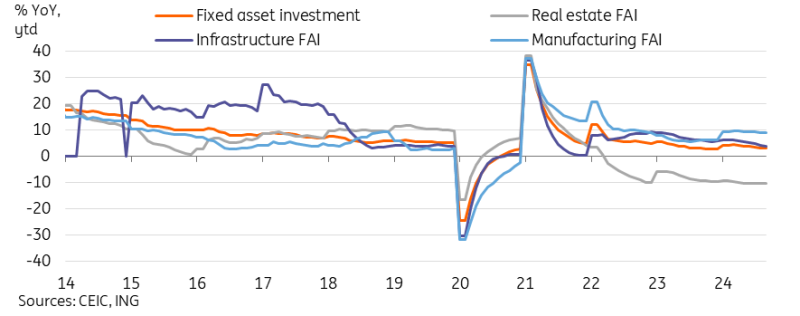
Fixed asset investment halted its 5-month downturn in September
Fixed asset investment (FAI) growth stabilised at 3.4% YoY ytd through the first three quarters of the year. This level was unchanged from the August read.
As could be expected this far into the year, most of the same trends remained little changed in this month's report. Public investment (6.1%) continued to significantly outpace private investment (-0.2%) as private sector sentiment remains downbeat and as fiscal spending ramps up in an attempt to stabilise growth.
Manufacturing FAI continued to outpace the headline number comfortably, edging up 0.1 pp to 9.2% YoY ytd. Many of the manufacturing subcategories remained in double-digit growth as China continues to upgrade its hi-tech manufacturing capabilities.
Infrastructure FAI slowed further to 4.1% YoY ytd, a sixth straight month of deceleration. This category has been disappointing this year as local governments control spending and obvious targets for new investment appear to be drying up. It is possible that with more fiscal transfers and measures to resolve debt difficulties expected ahead, local governments could be freed to spend more on infrastructure in 2025. While targets are certainly not as plentiful as in 2009, green development and urban renewal projects should still offer various categories for quality investment.
FAI remains one of the fastest routes to boost growth in the short-term, and it will be interesting to see how much of incoming fiscal stimulus is targeting new investment versus areas such as local government debt alleviation, stabilising the property market, or supporting consumption.
Manufacturing FAI continues to pace growth while real estate and infrastructure disappoint
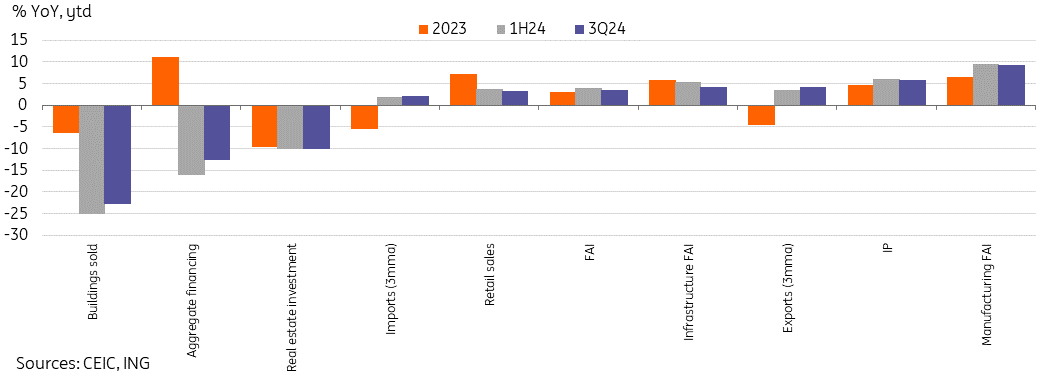
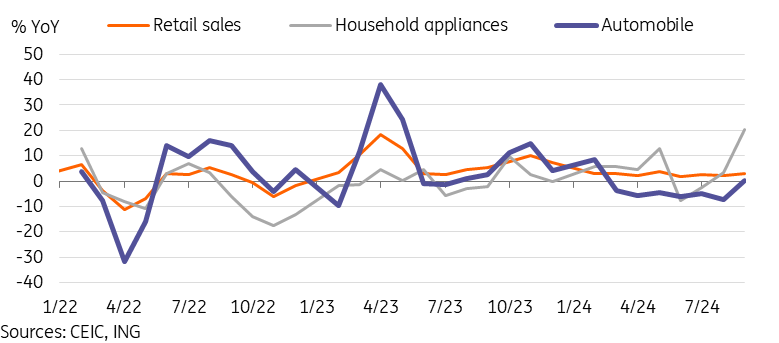
Trade-in policies boost retail sales to 4-month high but other categories still weak
Retail sales growth accelerated to 3.2% YoY in September, up from 2.1% YoY in August, representing a 4-month high. While this remains a far cry from previous years, the uptick was nonetheless higher than we and markets expected and brings the year-to-date retail sales growth to 3.3% YoY.
Looking at the breakdown of data, September's data signalled the impact of trade-in policies taking effect; these policies have primarily been concentrated in household appliances and automobiles so far, and are expected to be expanded in scale in the coming months. Household appliances grew by 20.5% YoY, which marked the strongest year-on-year growth of any category in the month. Auto sales also bounced back to 0.4% YoY, which does not appear particularly impressive at first glance but is worth highlighting due to turning positive after being in negative growth for the prior six months.
On the other hand, the "eat, drink, and play" theme, which has consistently outperformed throughout the year showed some signs of fragmenting in September's data. Catering (3.1%) and alcohol & tobacco (-0.7%) both underperformed headline growth, though sports and recreation (6.2%) continued to fare well.
Unsurprisingly, discretionary consumption that is not benefiting from policy support continued to remain in the doldrums. Gold and jewelry (-7.8%), cosmetics (-4.5%), and apparel (-0.4%) remained in year-on-year contraction. Property-related categories such as furniture (0.4%) and construction materials (-6.6%) continued to show weakness amid the property market struggles.
Retail sales buoyed by trade-in policy related categories
Value-added of industry rebounded but headwinds remain
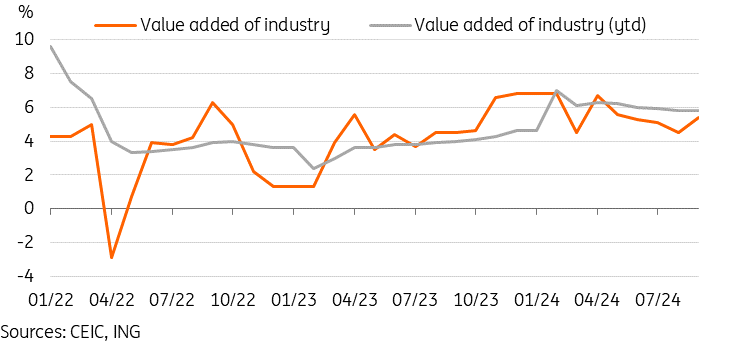
Value-added of industry rose to 5.4% YoY in September, up from 4.5% YoY in August and also beating expectations to hit a 4-month high.
Hi-tech manufacturing built upon recent strength, rising to 10.1% YoY, up from 8.6% the previous month. The same categories from previous months continued to drive overall manufacturing: semiconductors (17.9%), computers, communications, and electric equipment (10.6%), and rail, ships, and aeroplanes (13.7%) have all been consistently outperforming throughout the year.
Auto production edged up slightly in September, up to 4.6% YoY from 4.5% YoY in August. China's electric vehicle exports continue to be well-received in many markets due to a combination of price and quality factors.
Meanwhile, the pressure on property market-linked industries continued to be apparent. Cement (-10.3%), crude steel (-6.1%) and steel products (-2.4%) improved a little from August's numbers but remained a clear drag. This is unlikely to turn around until property or infrastructure investment recovers.
Industrial production bounced back in September
(Click on image to enlarge)
More By This Author:
Asia Week Ahead: Tokyo Inflation Takes Center Stage
FX Daily: Dollar Momentum Continues To Build
Rates Spark: Markets Now Contemplating A 50bp December ECB Cut
Disclaimer: This publication has been prepared by the Economic and Financial Analysis Division of ING Bank N.V. (“ING”) solely for information purposes without regard to any ...
more


