
The Canadian Dollar (CAD) rounded out the trading week by holding onto a 1.5% gain against the US Dollar after a frothy trading week gave way to a flattened Friday session. The Canadian Dollar struggled to find directional momentum during the week’s final market window as markets take a breather and await the next round of key inflation figures due next week.
Canada delivered a lopsided labor print on Friday, with another contraction in Net Change in Employment but a better-than-expected print in July’s Unemployment Rate. Investors have pivoted into waiting for next week’s US Producer Price Index (PPI) and Consumer Price Index (CPI) inflation figures, slated for Tuesday and Wednesday, respectively.
Daily digest market movers: Canadian Dollar flatlines on mixed labor
- Canada’s Net Change in Employment contracted in July, printing -2.8K versus the expected upswing to 22.5K from the previous month’s -1.4K.
- The Canadian Unemployment Rate held steady at 6.4% in July, averting the forecasted uptick to 6.5%.
- Canadian economic data remains thin next week, leaving USD/CAD traders to focus squarely on upcoming US inflation prints.
- US PPI and CPI inflation are broadly expected to tick lower as markets lean into Federal Reserve (Fed) rate cut hopes.
- Rate markets are pricing in better-than-even odds that Fed will kick off a rate cutting cycle with a 50-basis-point double cut in September.
Canadian Dollar PRICE This week
The table below shows the percentage change of Canadian Dollar (CAD) against listed major currencies this week. Canadian Dollar was the strongest against the Swiss Franc.
| USD | EUR | GBP | JPY | CAD | AUD | NZD | CHF | |
|---|---|---|---|---|---|---|---|---|
| USD | -0.06% | 0.37% | 0.06% | -0.98% | -0.90% | -0.75% | 0.73% | |
| EUR | 0.06% | 0.35% | -0.02% | -1.04% | -0.83% | -0.80% | 0.67% | |
| GBP | -0.37% | -0.35% | -0.32% | -1.36% | -1.15% | -1.14% | 0.33% | |
| JPY | -0.06% | 0.02% | 0.32% | -1.00% | -1.01% | -0.80% | 0.68% | |
| CAD | 0.98% | 1.04% | 1.36% | 1.00% | 0.11% | 0.24% | 1.54% | |
| AUD | 0.90% | 0.83% | 1.15% | 1.01% | -0.11% | 0.03% | 1.52% | |
| NZD | 0.75% | 0.80% | 1.14% | 0.80% | -0.24% | -0.03% | 1.49% | |
| CHF | -0.73% | -0.67% | -0.33% | -0.68% | -1.54% | -1.52% | -1.49% |
The heat map shows percentage changes of major currencies against each other. The base currency is picked from the left column, while the quote currency is picked from the top row. For example, if you pick the Canadian Dollar from the left column and move along the horizontal line to the US Dollar, the percentage change displayed in the box will represent CAD (base)/USD (quote).
Canadian Dollar price forecast: CAD gains poised to run aground of technical levels
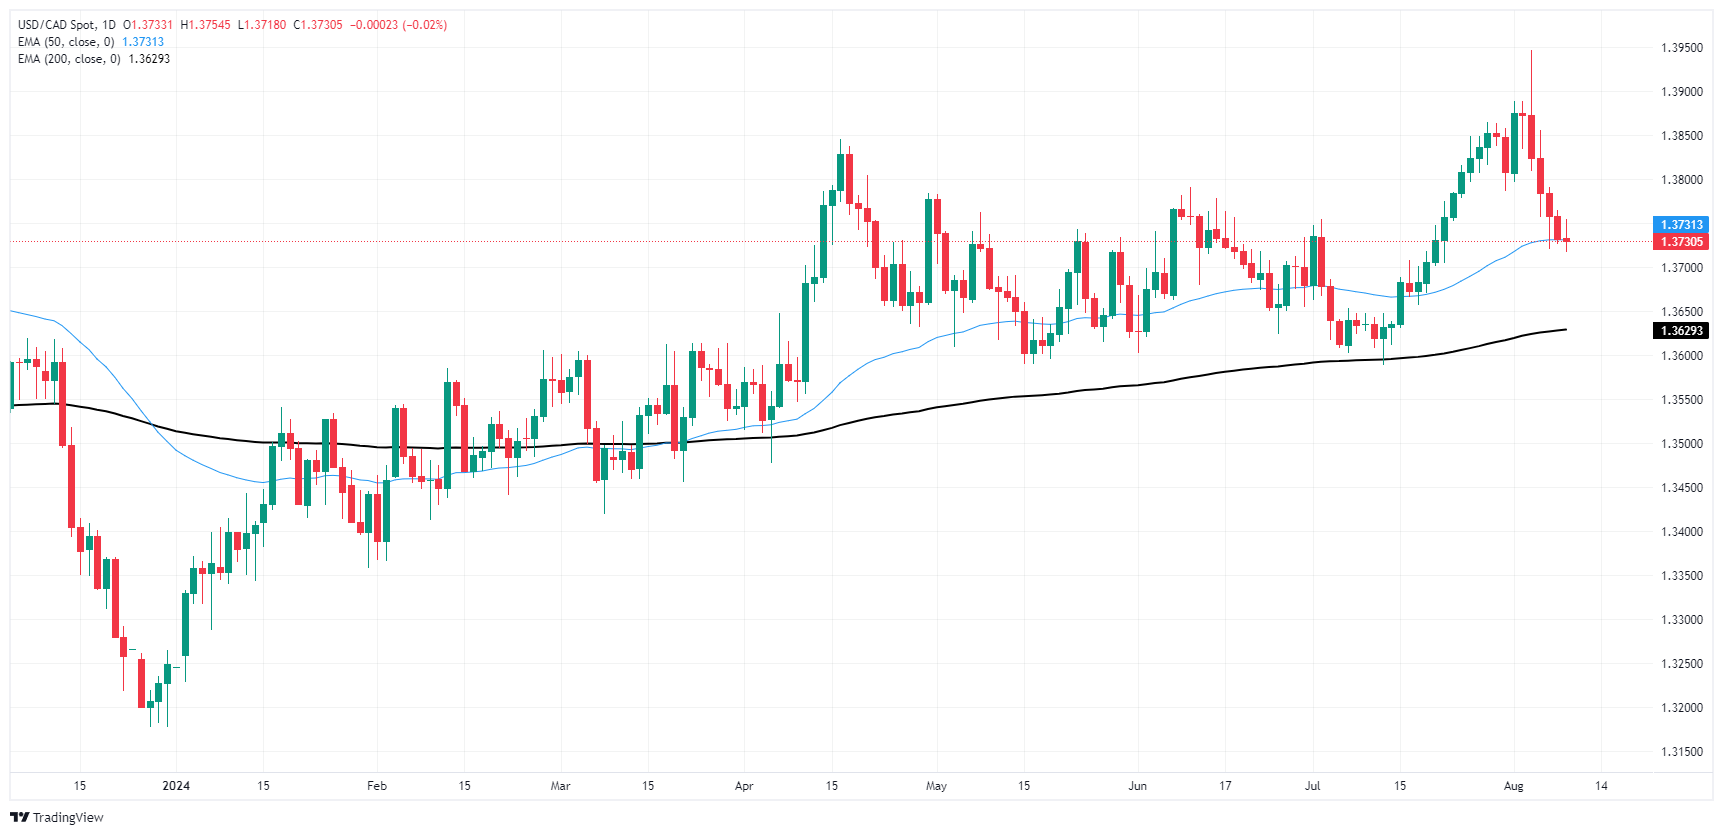
The Canadian Dollar (CAD) gave a surprisingly healthy performance this week, climbing over one percent against most of its major currency counterparts and running neck-and-neck with the Australian Dollar (AUD) as the week’s best-performing currencies. USD/CAD fell -1.64% peak-to-trough this week after Monday’s bullish spike failed to claim the 1.3950 level, sending the pair back into the low end near the 50-day Exponential Moving Average (EMA) near 1.3730.
Friday’s flat print in USD/CAD daily candlesticks comes on the heels of five consecutive daily sessions in the red. However, the pair is still holding onto chart paper on the bullish side of the 200-day EMA at 1.3629, and Canadian Dollar buyers are running out of opportunities to drag USD/CAD lower with price action battling for a foothold above the 1.3700 handle.
USD/CAD daily chart
(Click on image to enlarge)
More By This Author:
EUR/USD Churns After A Week Of Directionless Weight-Shifting
EUR/USD Cycles Near 1.0900 As Fiber Traders Tread Water
EUR/USD Pulls Into The Middle Just Above 1.0900


Comments
Log in or sign up to join the conversation.