
Bovespa Elliott Wave Technical Analysis
Bovespa Index – Elliott Wave Analysis – Trading Lounge – Daily Chart
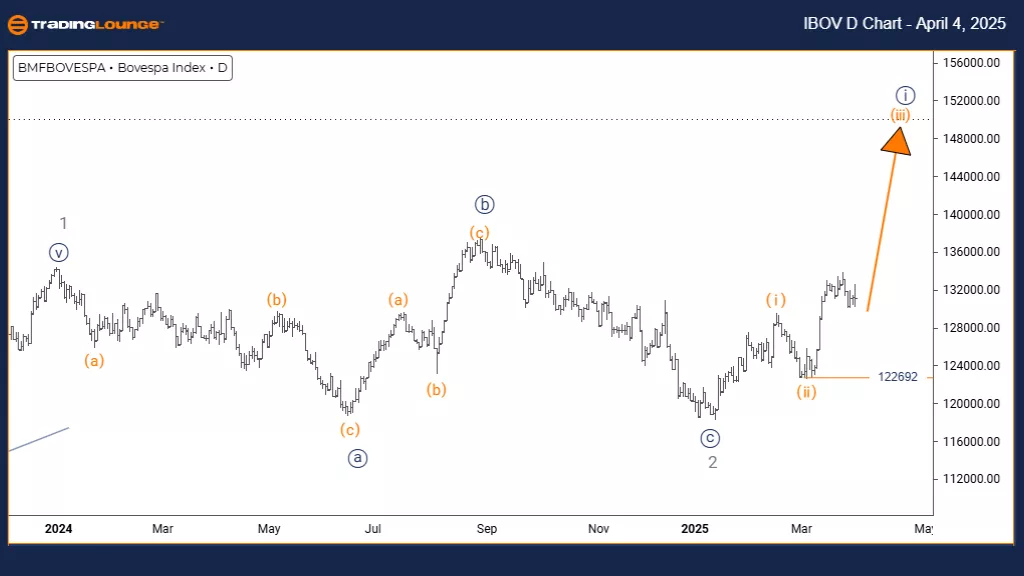
Bovespa Index – Daily Elliott Wave Technical Analysis
FUNCTION: Bullish Trend
MODE: Impulsive
STRUCTURE: Orange wave 3
POSITION: Navy blue wave 1
DIRECTION NEXT LOWER DEGREES: Orange wave 4
DETAILS: Orange wave 2 appears completed; orange wave 3 is now active.
Wave Cancel Invalid Level: 122,692
The Bovespa Index daily Elliott Wave analysis outlines a strong bullish trend in Brazil’s primary stock index. The key structure under observation is orange wave 3, a segment that fits into the broader navy blue wave 1 pattern in the overall wave count.
Technical indicators suggest that orange wave 2 has concluded its corrective phase, allowing price action to transition into the upward phase of orange wave 3. Historically, this wave is typically the most dynamic and extended in Elliott Wave patterns, pointing to substantial upside potential.
The invalidation point is identified at 122,692. A break below this level would challenge the current bullish forecast. This daily chart analysis offers traders clear insight into the ongoing impulsive move, while maintaining context within the higher wave degree structure.
Upon completion of orange wave 3, the index is expected to pull back into orange wave 4 before possibly resuming upward progress into orange wave 5. This analytical model emphasizes wave relationships, showing orange wave 3 as both an immediate opportunity and part of the broader navy blue wave 1 advance.
Traders should look for traits typical of third waves—strong upward momentum, increased volume, and extended gains. This technical scenario favors holding long positions, with proper risk controls near the invalidation zone.
This analysis offers actionable insight for investors looking to benefit from Brazil’s bullish momentum, with the daily chart providing clear guidance for entry and exit strategies.
Bovespa Index – Elliott Wave Analysis – Trading Lounge – Weekly Chart
Bovespa Index – Weekly Elliott Wave Technical Analysis
FUNCTION: Bullish Trend
MODE: Impulsive
STRUCTURE: Navy blue wave 1
POSITION: Gray wave 3
DIRECTION NEXT LOWER DEGREES: Navy blue wave 2
DETAILS: Gray wave 2 appears completed; navy blue wave 1 is now developing.
The Bovespa Index weekly Elliott Wave analysis outlines a promising bullish setup for Brazil’s main stock index. This forecast highlights the formation of navy blue wave 1, which fits within the broader structure of gray wave 3, signaling the start of a potentially powerful uptrend.
With the correction of gray wave 2 now complete, the index is beginning to build momentum in navy blue wave 1—an impulsive wave often associated with early trend development. This phase marks the foundation of a larger bullish sequence for the Bovespa Index.
This weekly chart perspective offers long-term traders and investors a clear understanding of the index’s position within the broader Elliott Wave count. The structure suggests that after the completion of navy blue wave 1, a retracement in navy blue wave 2 may occur before continued upside movement in navy blue wave 3.
Wave relationships are central to this analysis. Navy blue wave 1 represents both a medium-term opportunity and part of the more extensive gray wave 3 rally. Traders should look for gradual momentum increases and rising volume—typical signs of a wave 1 in early-stage bullish markets.
The current setup presents favorable conditions for initiating long positions, provided traders maintain careful risk management strategies. The weekly timeframe delivers high-level visibility for traders aiming to position themselves at the early stages of what could be a notable upward move in Brazil’s equity market.

Technical Analyst: Malik Awais
More By This Author:
Elliott Wave Technical Analysis: U.S. Dollar/Swiss Franc - Friday, April 4
Elliott Wave Technical Analysis: SEI Crypto Price News Today
Elliott Wave Technical Forecast: Newmont Corporation - Thursday, April 3
At TradingLounge™, we provide actionable Elliott Wave analysis across over 200 markets. Access live chat rooms, advanced AI & algorithmic charting tools, and curated trade ...
more

