
Elliott Wave Technical Analysis: SEI Crypto Price News Today
Elliott Wave Analysis - TradingLounge Daily Chart,
SEI/ U.S. Dollar (SEIUSD)
SEIUSD Elliott Wave Technical Overview
- Function: Trend Continuation
- Mode: Motive
- Structure: Impulse Pattern
- Current Position: Wave V
- Higher Degree Direction: Wave C within a Flat Pattern
- Invalidation Level for Wave Count: —
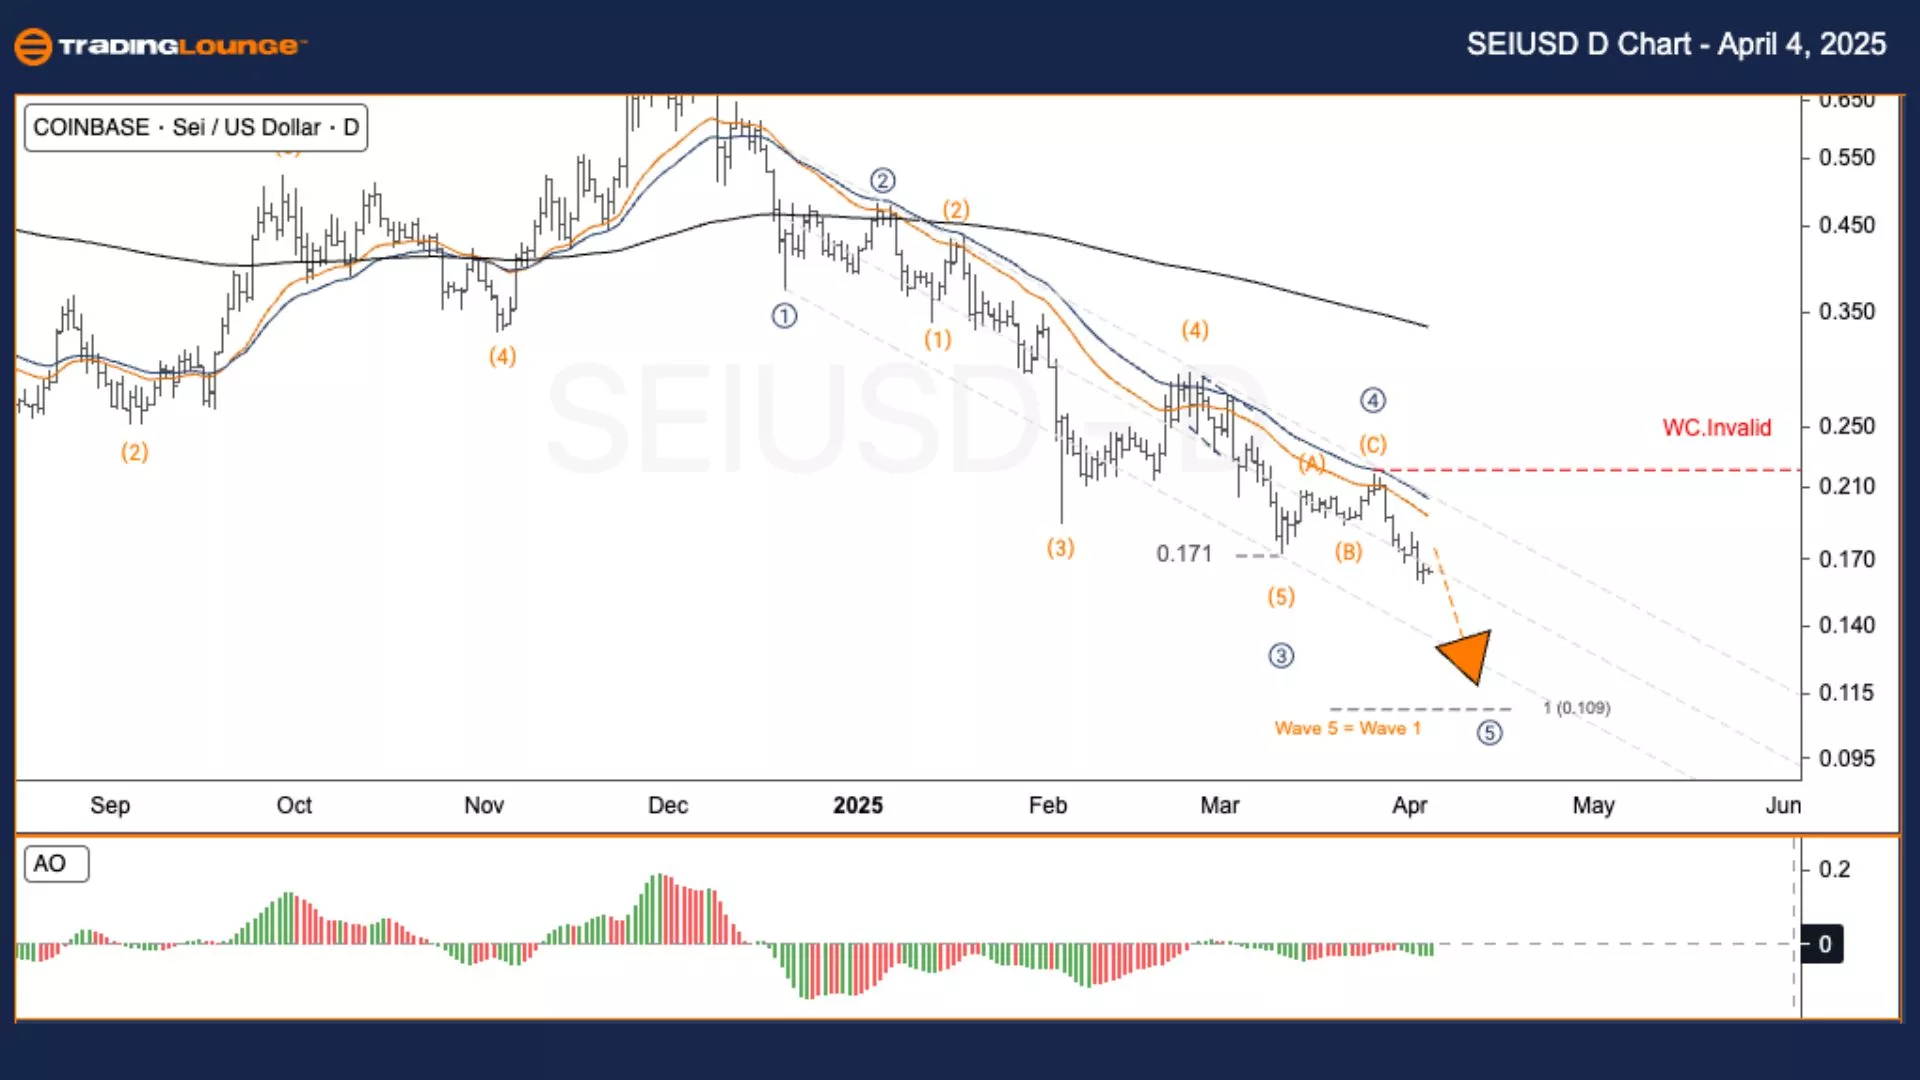
SEI/USD Trading Strategy - Daily Chart Insight
SEI recently experienced strong upward momentum. Now, based on Elliott Wave analysis, it appears to be undergoing a three-wave corrective pattern (A)-(B)-(C). Currently, Wave C is unfolding and progressing through the fifth wave (Wave 5), likely nearing completion. This last wave of the structure is trending downward.
-
Target for Wave 5: Expected to align with the bottom of Wave 1, at the 0.1094 price level.
Trading Strategies
-
Primary Strategy
-
Swing Traders (Short-Term Approach)
-
Watch Zone: Monitor price activity closely around 0.109 – 0.12.
-
If a bullish divergence or a strong reversal candle appears, it might signal the end of Wave C and the beginning of a new upward move.
-
-
-
Risk Management
-
Critical Resistance (Wave Count Invalidates): 0.2300
-
If price returns above this level, the current Elliott Wave structure becomes invalid.
-
-
Elliott Wave Analysis - TradingLounge H4 Chart,
SEI/ U.S. Dollar (SEIUSD)
SEIUSD Elliott Wave Technical Overview
- Function: Trend Continuation
- Mode: Motive
- Structure: Impulse Pattern
- Current Position: Wave V
- Higher Degree Direction: Wave C within a Flat Pattern
- Invalidation Level for Wave Count: —
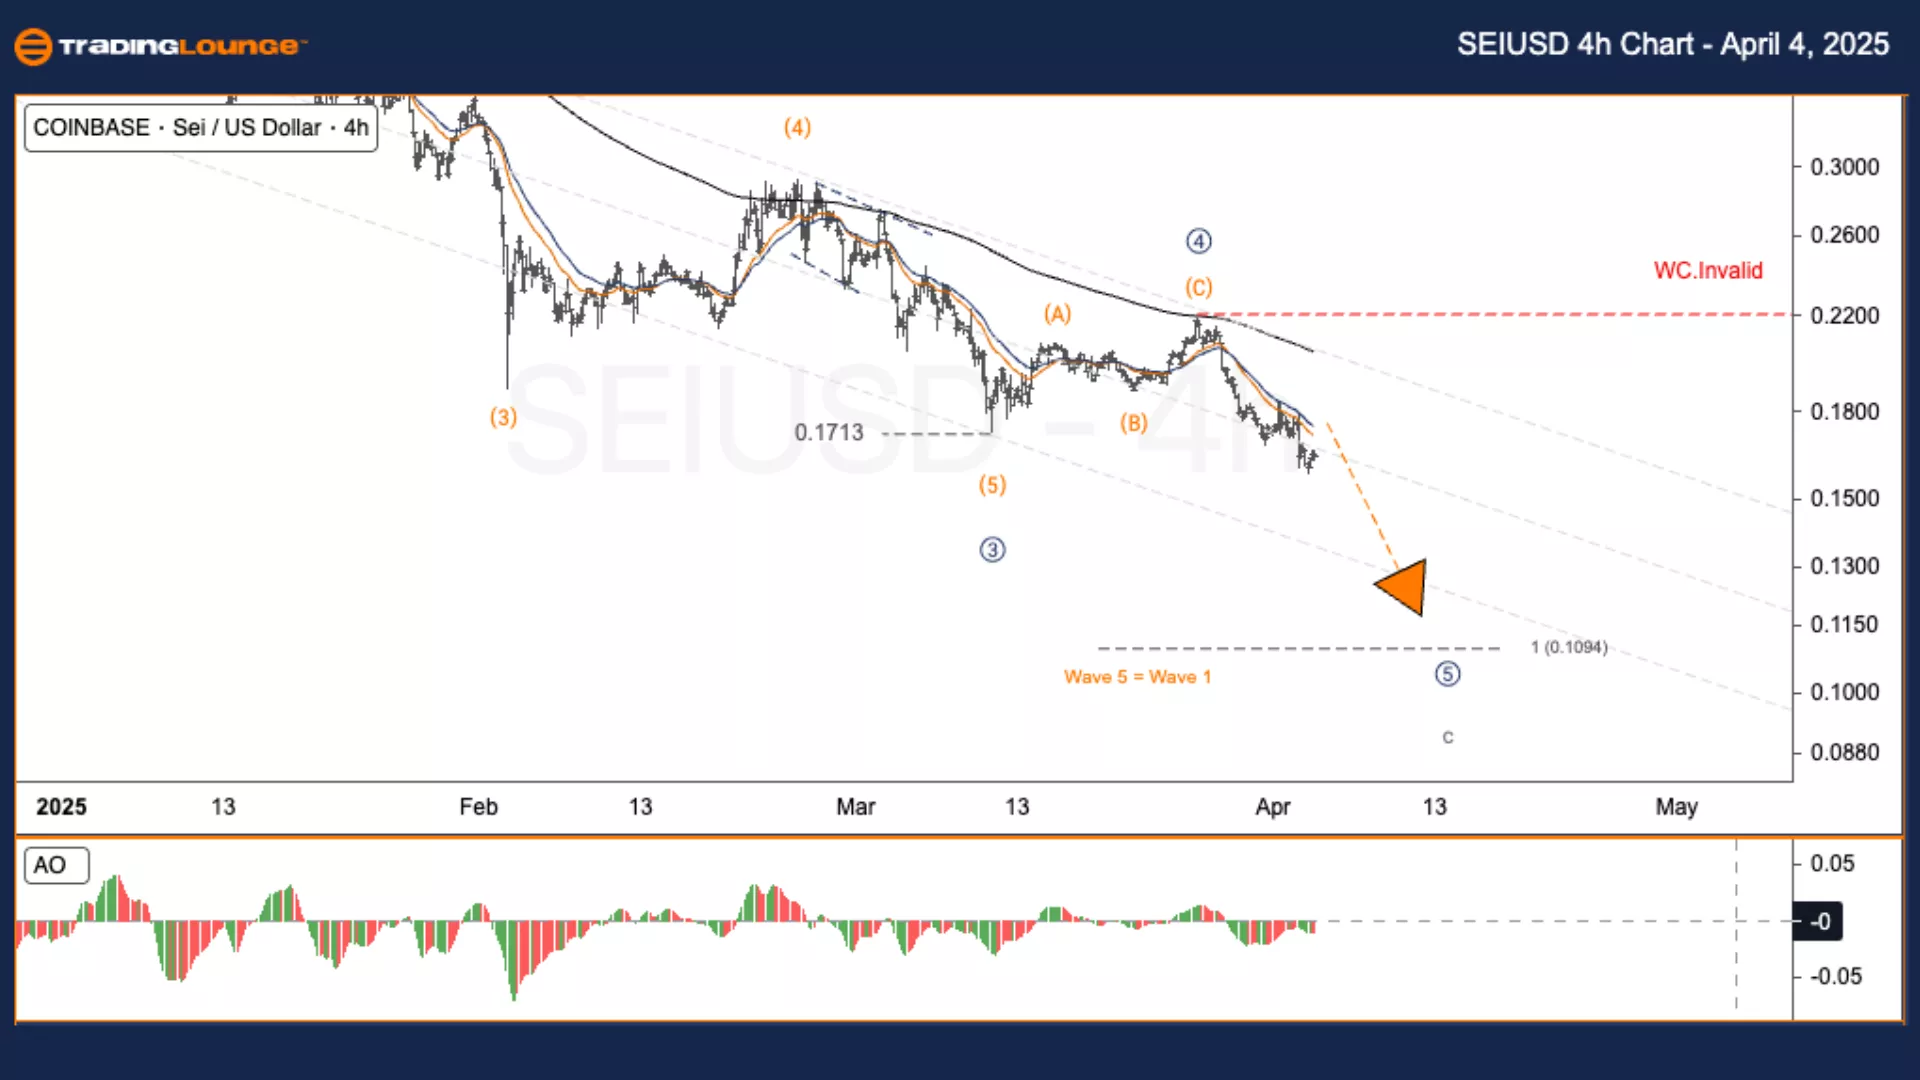
SEI/USD Trading Strategy - 4-Hour Chart Insight
Following a significant rally in the past, SEI has now shifted into a corrective wave sequence labeled (A)-(B)-(C). The last part of this correction, Wave C, is currently unfolding and seems to be in the final stage—Wave 5. The wave continues to trend downward.
-
Wave 5 Target: Expected near the 0.1094 level, in alignment with Wave 1’s base.
Trading Strategies
-
Primary Strategy
-
Swing Traders (Short-Term View)
-
Watch Zone: Look for potential entry signals around 0.109 – 0.12.
-
A clear bullish divergence or reversal candle in this area might signal a trend change.
-
-
-
Risk Management
-
Invalidation Resistance: 0.2300
-
A move back above this level will invalidate the current wave count.
-
-
Analyst: Kittiampon Somboonsod, CEWA
More By This Author:
Elliott Wave Technical Forecast: Newmont Corporation - Thursday, April 3
Elliott Wave Technical Analysis: Wheat - Thursday, April 3
Elliott Wave Technical Analysis: The Boeing Company - Thursday, April 3
At TradingLounge™, we provide actionable Elliott Wave analysis across over 200 markets. Access live chat rooms, advanced AI & algorithmic charting tools, and curated trade ...
more

