
We talked about AUDNZD back on August 26, where we mentioned and highlighted strong resistance.
AUDNZD is nicely turning down now from projected 61,8% Fibo. retracement and 1.11-1.12 resistance area. A decline looks quite strong, so it can be at the beginning of a bearish wave (C) with a leading diagonal pattern into wave 1 that can be now followed by a pullback in wave 2. It can actually revisit the 1.10x resistance area as a right shoulder of Head&Shoulders pattern before a bearish continuation within wave 3 of a five-wave bearish cycle, especially if later breaks below 1.0735 bearish confirmation level.
(Click on image to enlarge)
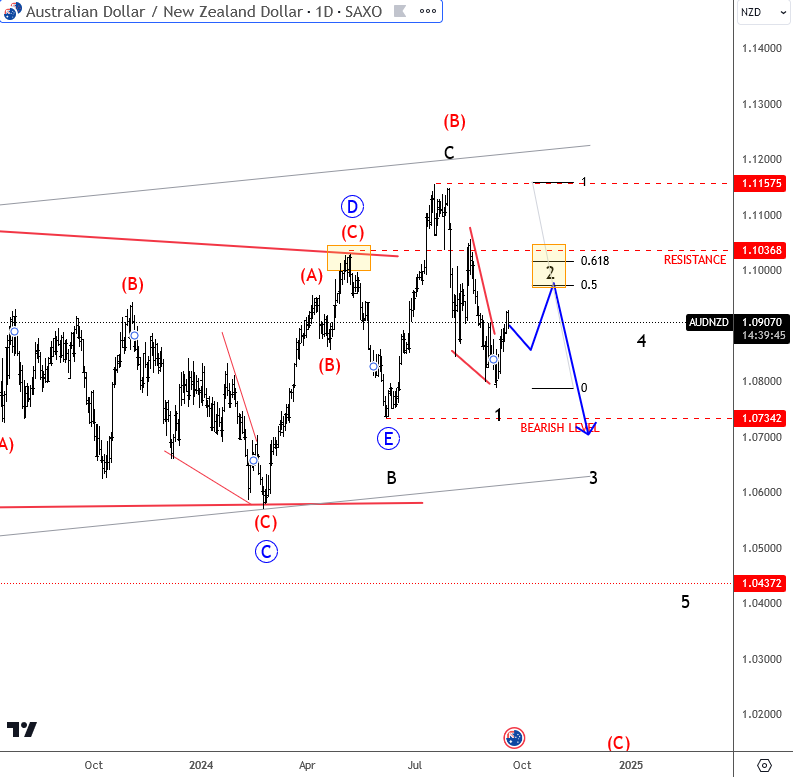
AUDNZD Daily Chart
For more analysis like this, you may want to watch below our latest recording of a live webinar streamed on September 16 2024:
More By This Author:
Elliott Wave: Can FED's Cuts Send Dollar To 100 Or Lower?
USDJPY And Connection With Stocks
Elliott Wave Update: Crude Shows Inflation Can Soften


Comments
Log in or sign up to join the conversation.