AUD/JPY Price Analysis: Bearish Pressure Intensified, Potential Short-Term Rebound Signaled

Image Source: Pixabay
- The hourly chart portrayed the RSI as being in the oversold territory, signaling a potential short-term rebound.
- On a broader perspective, the AUD/JPY pair remained above the main SMAs, indicating long-term bullish sentiment.
- The daily RSI was also in negative territory, illustrating increasing selling pressure.
- In the next trading sessions, the sellers may take a step back to consolidate their movements.
In Friday's trading session, the AUD/JPY currency pair was seen trading at around the 97.49 level, demonstrating a loss of 0.38%. While the pair was dominated by sellers, oversold conditions seen on the hourly chart seemingly suggested that the pair may see some upside in the short-term to consolidate.
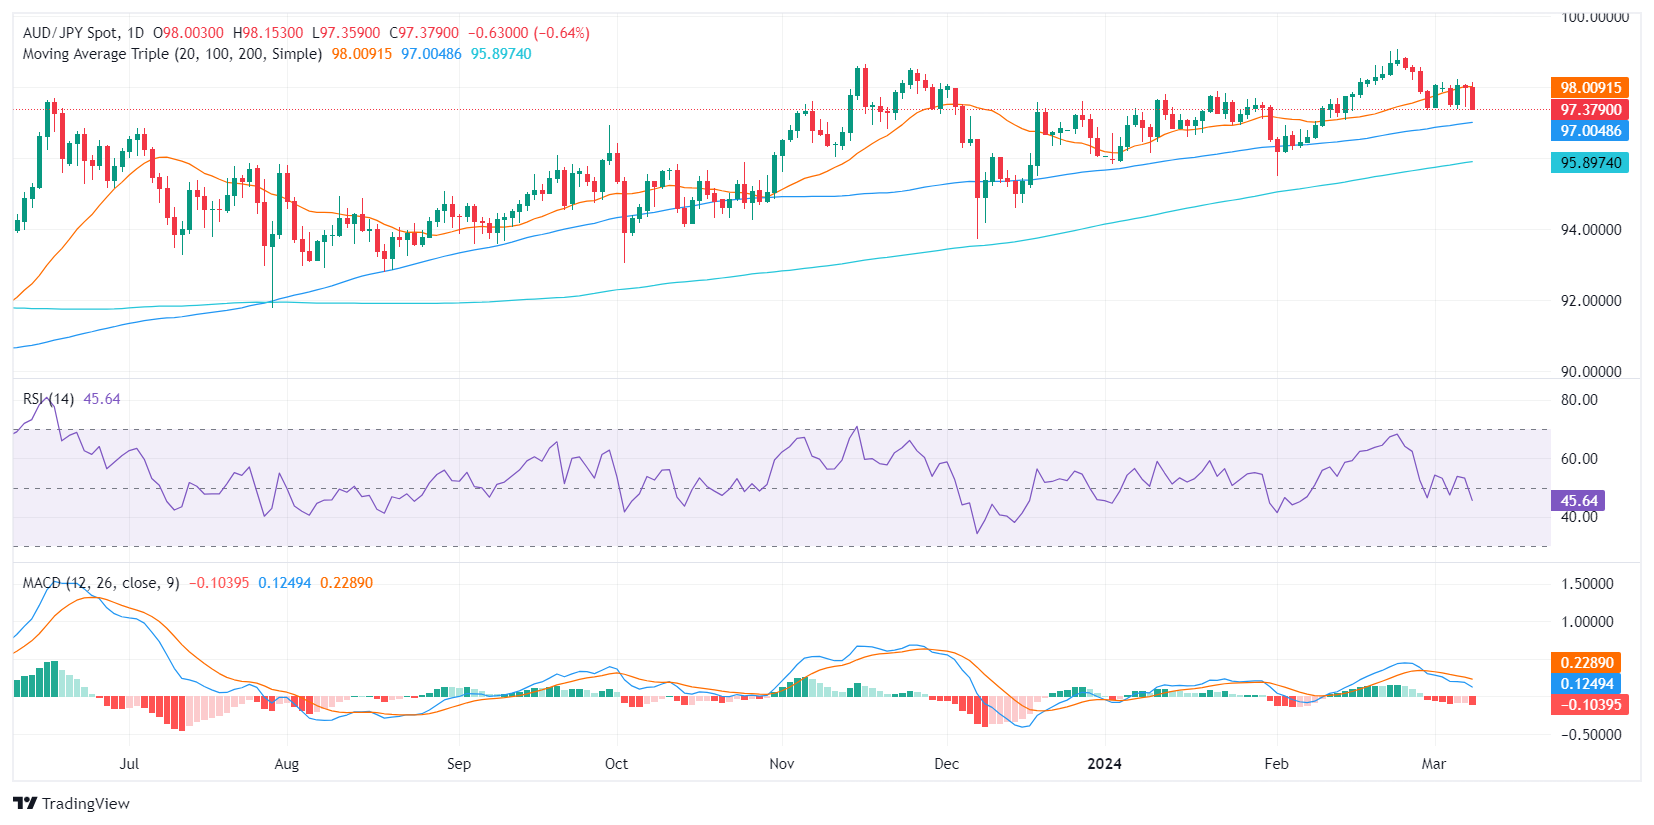
Analyzing the daily chart, the pair's Relative Strength Index (RSI) rested in negative territory, showcasing stronger selling momentum. In line with that, the Moving Average Convergence Divergence (MACD) histogram showed increasing negative momentum with rising red bars.
Despite the ongoing bearish trend, the pair managed to stay above the 100- and 200-day Simple Moving Averages (SMAs), signifying a favorable condition for the bulls overall.
AUD/JPY Daily Chart

(Click on image to enlarge)
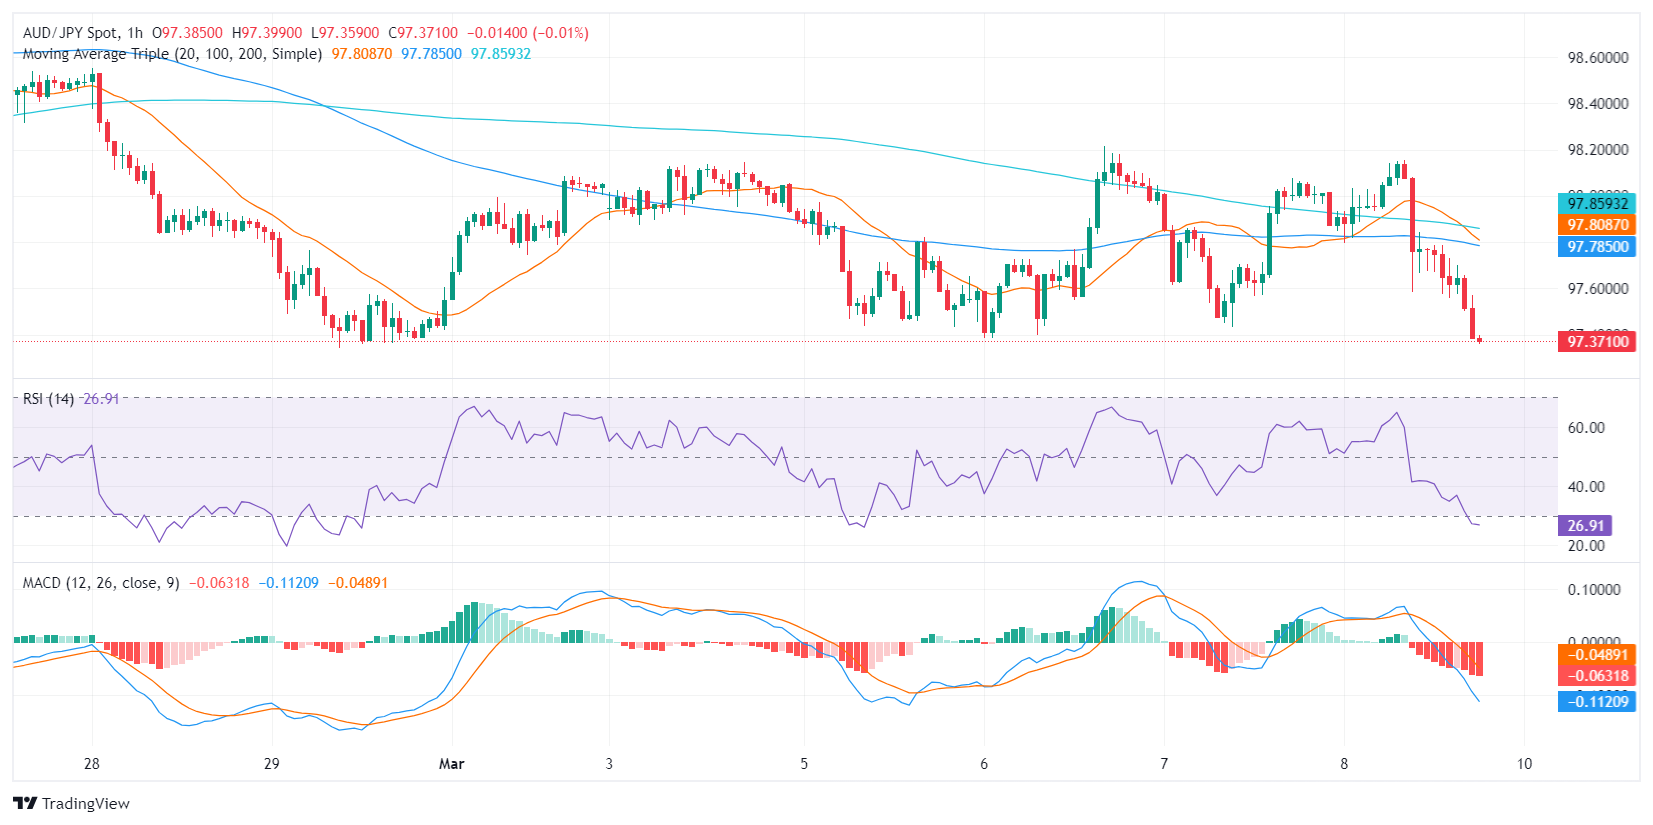
Zooming into the hourly chart, the RSI was seemingly located in the oversold territory, contrasting sharply with the daily chart and suggesting a possible short-term rebound due to oversold conditions. Likewise, the MACD illustrated increasing negative momentum on the hourly chart, aligning with the daily analysis.
Despite differing conditions outlined in the hourly and daily charts, both depicted dominant bearish forces, with the bulls maintaining their stance in the broader spectrum and demonstrating the possibility of a bullish rebound in the short-term.
AUD/JPY Hourly Chart

(Click on image to enlarge)
AUD/JPY Technical Levels

More By This Author:
GBP/USD Price Analysis: Appreciates To Near 1.2810 Followed By December’s High
Silver Price Analysis: XAG/USD Shines Above $24.00 Fueled By Soft US Dollar
USD/CAD Price Analysis: Threatening To Break Below Key Trendline
Disclosure: Information on this article contains forward-looking statements that involve risks and uncertainties. Markets and instruments profiled on this page are for informational purposes ...
more


