

Image Source: Unsplash
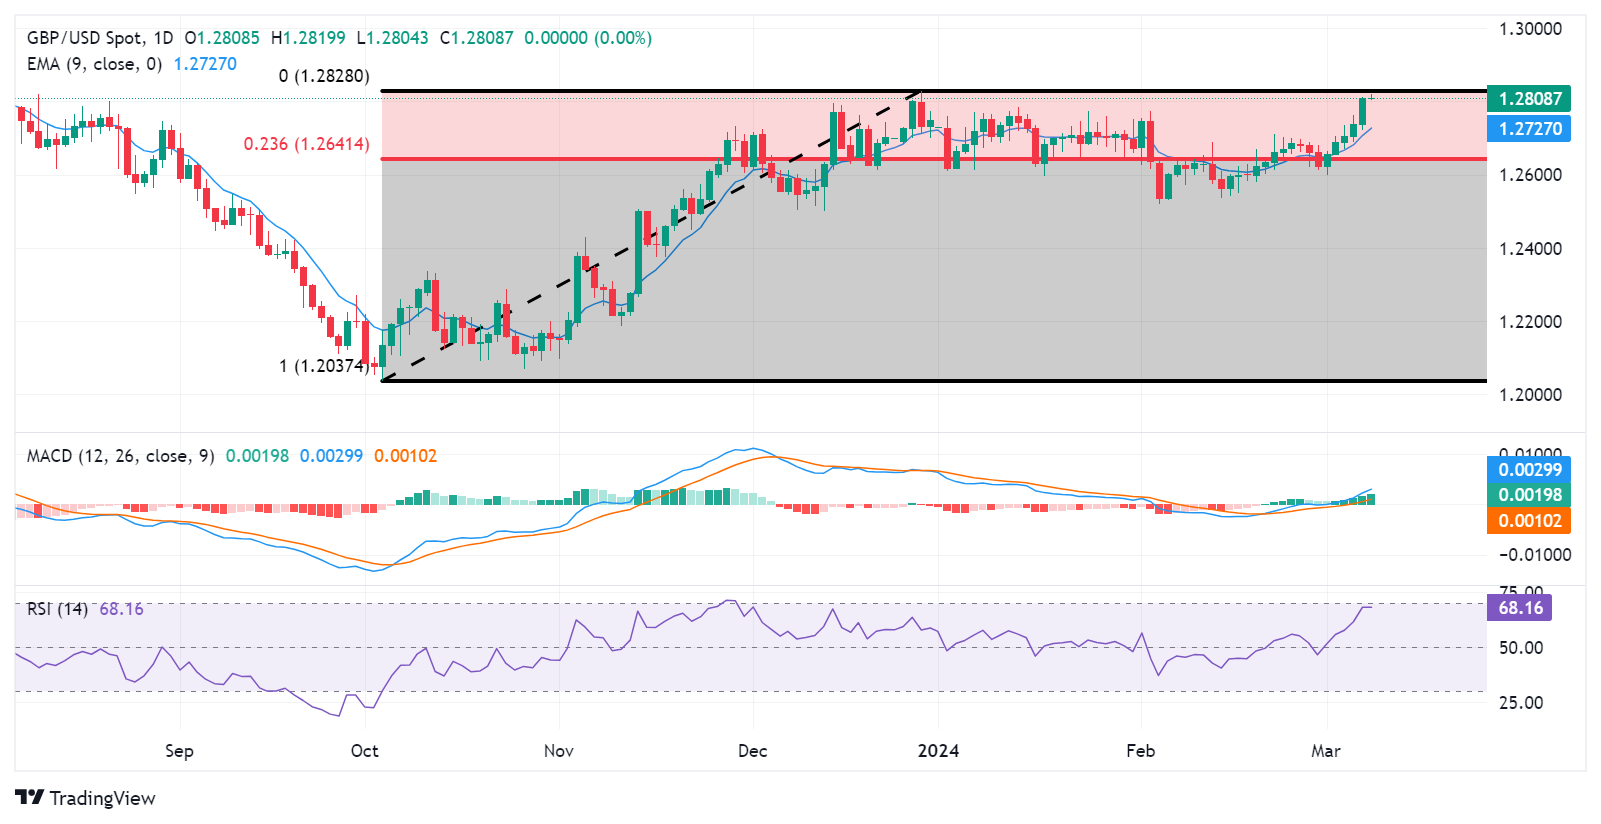
- GBP/USD targets December high at 1.2828 and August high at 1.2841.
- Technical analysis suggests a confirmation of the bullish trend for the pair.
- The psychological level of 1.2800 appears as an immediate support level.
GBP/USD seems to continue its winning streak that began on March 1, hovering around 1.2810 during the Asian session on Friday. The GBP/USD pair receives upward support as the US Dollar (USD) faces challenges on improved risk appetite amid lower US Treasury yields.
The GBP/USD pair finds the immediate barriers at December’s high at 1.2828 and August’s high at 1.2841. A break above these levels could support the pair to test the major level of 1.2850, followed by the psychological resistance area around the 1.2900 level.
The technical analysis of the GBP/USD pair shows that the 14-day Relative Strength Index (RSI) is positioned above 50. This indicates a bullish momentum for the pair. Additionally, the Moving Average Convergence Divergence (MACD), a lagging indicator, suggests a confirmation of the bullish trend for the pair. This is evident from the MACD line being situated above the centerline and shows the divergence above the signal line.
The GBP/USD pair may encounter immediate support at the psychological level of 1.2800 following further support near the major level at 1.2750. A break below the major level could push the pair to test the nine-day Exponential Moving Average (EMA) at 1.2726.
Further support lies at the psychological level of 1.2700, a surpassing of this level could lead the GBP/USD pair to test the 23.6% Fibonacci retracement level of 1.2641.
GBP/USD: Daily Chart
GBP/USD
| OVERVIEW | |
|---|---|
| Today last price | 1.2807 |
| Today Daily Change | -0.0002 |
| Today Daily Change % | -0.02 |
| Today daily open | 1.2809 |
| TRENDS | |
|---|---|
| Daily SMA20 | 1.2652 |
| Daily SMA50 | 1.2674 |
| Daily SMA100 | 1.2576 |
| Daily SMA200 | 1.2583 |
| LEVELS | |
|---|---|
| Previous Daily High | 1.2811 |
| Previous Daily Low | 1.2723 |
| Previous Weekly High | 1.27 |
| Previous Weekly Low | 1.26 |
| Previous Monthly High | 1.2773 |
| Previous Monthly Low | 1.2518 |
| Daily Fibonacci 38.2% | 1.2777 |
| Daily Fibonacci 61.8% | 1.2757 |
| Daily Pivot Point S1 | 1.2751 |
| Daily Pivot Point S2 | 1.2693 |
| Daily Pivot Point S3 | 1.2663 |
| Daily Pivot Point R1 | 1.2839 |
| Daily Pivot Point R2 | 1.2869 |
| Daily Pivot Point R3 | 1.2927 |
More By This Author:
Silver Price Analysis: XAG/USD Shines Above $24.00 Fueled By Soft US Dollar
USD/CAD Price Analysis: Threatening To Break Below Key Trendline
Fed Chair Appears Before House To Deliver Monetary Policy Report


Comments
Log in or sign up to join the conversation.