As The UK Targets Net Zero By 2050, The S&P UK PACT Indices Can Too
The UK set goals of reaching net zero targets by 2050; these targets include transitioning to cleaner power and a more sustainable future, securing 440,000 well-paid jobs, and protecting the British consumer from global fossil fuels price spikes.1
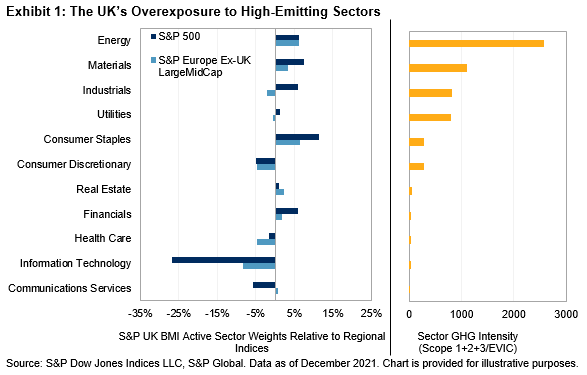
The UK equity market certainly has some work to do, given its high weight in carbon-intensive sectors, compared with the rest of Europe and the U.S.

Larger weights in highly intensive sectors are reflected in the high weighted average carbon intensity across sectors in the UK (see Exhibit 2). This tests the efficiency and flexibility of the S&P PACT™ Indices (S&P Paris-Aligned & Climate Transition Indices) methodology, as many stocks must be removed due to the strict fossil fuel exclusions required by the EU’s minimum standards for Paris-aligned benchmarks.2

While net zero alignment may be a key target, it isn’t the only climate or ESG concern. Climate change potentially exposes market participants to transition and physical risks, while broader ESG factors may be ethically desirable, financially material, or both. Many of these ESG factors are uncorrelated,3 so gaining exposure to one likely doesn’t provide exposure to the others without explicit control.
S&P DJI offers two approaches that seek to align with a targeted climate scenario, alongside other ESG objectives: 4
The S&P PACT Indices represent a sophisticated strategy, targeting a 1.5°C scenario/2050 net zero compatibility. Additionally, the indices aim to meet the EU minimum standards for Climate Transition benchmarks (CTBs) and EU Paris-aligned benchmarks (PABs) and the Task Force on Climate-related Financial Disclosures (TCFD) recommendations as efficiently as possible, allowing for broad, diverse indices.
Undesirable exposures are excluded, then remaining constituents are reweighted (see Exhibit 3). This reweighting, framed within the TCFD recommendations on climate-related financial risks and opportunities, allocates toward companies that are more compatible with a 1.5°C scenario, green-revenue driven, science-based target setters, and have high ESG scores, while reweighting away from those with high greenhouse gas (GHG) intensity, potential physical risk exposure, and fossil fuel reserves—while maintaining high climate impact exposure.

The S&P PACT Indices are designed to be 1.5°C scenario and 2050 net zero compatible by reducing GHG emissions intensity against the underlying index (30% for CTB-aligned indices and 50% for PAB-aligned indices) and subsequently decarbonizing by 7% year-on-year. Additionally, a forward-looking academic model-based measure assigns companies their fair share of the global 1.5°C carbon budget, while incorporating companies’ forward-looking decarbonization targets.
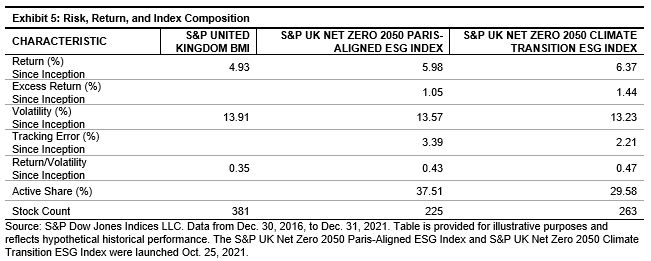
How have they performed historically? Both the Paris-aligned and climate transition index variants have shown an excess return over the underlying index (see Exhibit 4), with lower volatility (see Exhibit 5).


Interestingly, the S&P UK Net Zero 2050 Paris-Aligned ESG Index has had a statistically significant and economically meaningful small size exposure, unseen in the climate transition index (see Exhibit 6). This can likely be explained by the extra exclusions the Paris-aligned index makes, which led to the removal of five of the nine largest companies, accounting for over 15% of the index weight. The S&P UK Net Zero 2050 Climate Transition ESG Index’s factor exposures have been more in line with the benchmark.

Overall, the UK equity market has been characterized by highly carbon-intensive sector exposures, a test of the S&P PACT Index methodology’s efficiency. The S&P UK PACT Indices have been up to the task, offering benchmark-like characteristics while aligning with net zero by 2050, TCFD recommendations, and broad ESG objectives.
1 This net zero target and the impacts are stated by the UK government.
2 Regulation (EU) 2016/1011
3 Exploring S&P PACT Indices Weight Attribution (Leale-Green & Velado, 2019)
4 We offer two approaches within the U.K. Other regional variants are also live.
Disclaimer: For more information on the risk-adjusted performance of actively managed funds compared with their benchmarks in 2018, read our latest more


