

Image Source: Pexels
The Fernald-Hsu-Spiegel China Cyclical Activity Tracker (CCAT) indicates Q3 growth 0.26 standard deviation below trend.
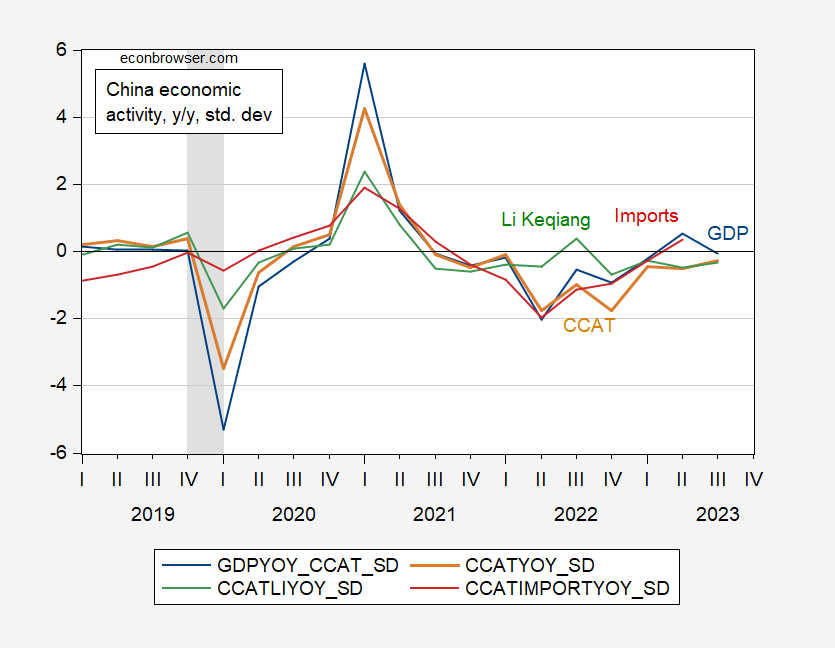
Figure 1: GDP y/y growth in standard deviations below trend (blue), CCAT (tan), Li Keqiang index (green), imports (red). Source: CCAT/SF Fed, accessed 11/8/2023.
Detrended GDP growth is approximately 2.4%, so a below trend reading of 0.26 is 0.62%; since estimated trend growth is 5.07% in Q3, then implied Q3 growth is 4.45%, somewhat below the 4.9% according to official NBS figures. Interestingly, the Li Keqiang index (the first principal component of indicators) implies about the same growth rate. In both cases, the gap between official and alternatives is much larger in Q2.
BOFIT’s alternative calculations for Q3 average is 3.43%, with a high/low range of 5.11%/2.08%.
More By This Author:
Euro Area Treading WaterThe Household Employment Series Turns Down
Weekly Macro Indicators, Through 10/28


Comments
Log in or sign up to join the conversation.