
Image Source: Kevin Smith on Flickr
IPO Watch
The IPO market is getting some renewed interest with AI-stock CoreWeave (CRWV) performing well and the upcoming offering of fintech company Circle (CRCL) later this week.
While the AI boom has been raging for over two years now, we have yet to see a big uptick in IPOs similar to what we saw during the Dot Com boom of the late 1990s. Most of that is due to successful private companies now preferring to stay ‘private for longer’, but we’d expect at least an eventual uptick in companies going public if AI is going to have staying power.
We looked at all of the stocks that have gone public in the US over the last couple of years and found 45 that are above $250 million in market cap save a few single-drug biotech offerings.
We’ve broken them into four categories: ones that are in uptrends, ones that are in the process of breaking downtrends, ones that are in sideways trends, and ones that are in downtrends.Our goal with this analysis is to give Bespoke subscribers some ideas to research further to see if any pique their interest.
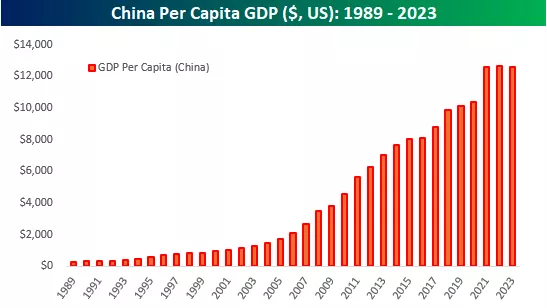
China Per Capita GDP
Today marks the 36th anniversary of Tiananmen Square. While the government’s actions in 1989 were a big blow to democracy and saw individual freedoms get crushed, China has seen a major surge in its wealth. In 1989, per capita GDP in China was less than $311. Today, it’s $12,614, representing an increase of 3,950%. Over that same period, US per capita GDP increased by less than 260%.
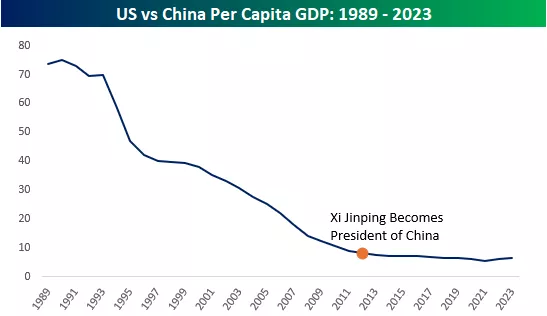
Comparing per capita GDP in China to the US shows how the gap has narrowed. While US per capita GDP is still 6.5 times the level of China, in 1989, US per capita GDP was more than 70 times China's! While China has narrowed the gap in a big way, its rate of growth relative to the US has slowed considerably in recent years. In the ten years leading up to Xi Jinping becoming President in 2013, the ratio of US to Chinese per capita GDP shrank from 30.6 to 7.6. Since Xi became President in 2013, the ratio has declined from 7.6 to 6.5.
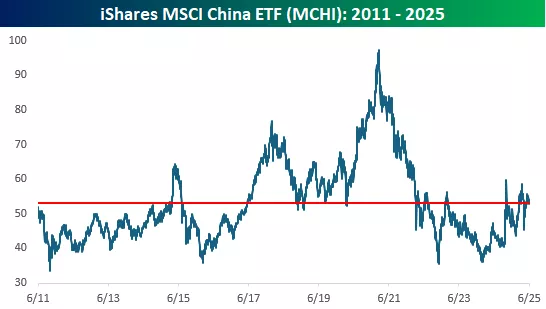
The slowing growth of China has also been reflected in the performance of Chinese stocks. While the iShares MSCI China ETF (MCHI) has seen some big moves, both up and down over the last 10+ years, its price is essentially unchanged from where it was 14 years ago.
More By This Author:
No More Juice - The Rise And Fall Of Orange Juice FuturesFarewell To May
The Next Mega-Caps?


Comments
Log in or sign up to join the conversation.