GDP Vs. Human Development Index: US, China And Norway
Several commentators (e.g., [1] [2]) keep on taking me to task for citing GDP as if it was the variable of ultimate concern. I have repeatedly noted GDP is a measure of economic activity, not a measure of economic welfare. However, in order to deter these repetitive and sometimes sententious comments, I’ll provide some graphs to illustrate the difference between a measure of economic activity, and a measure of welfare.
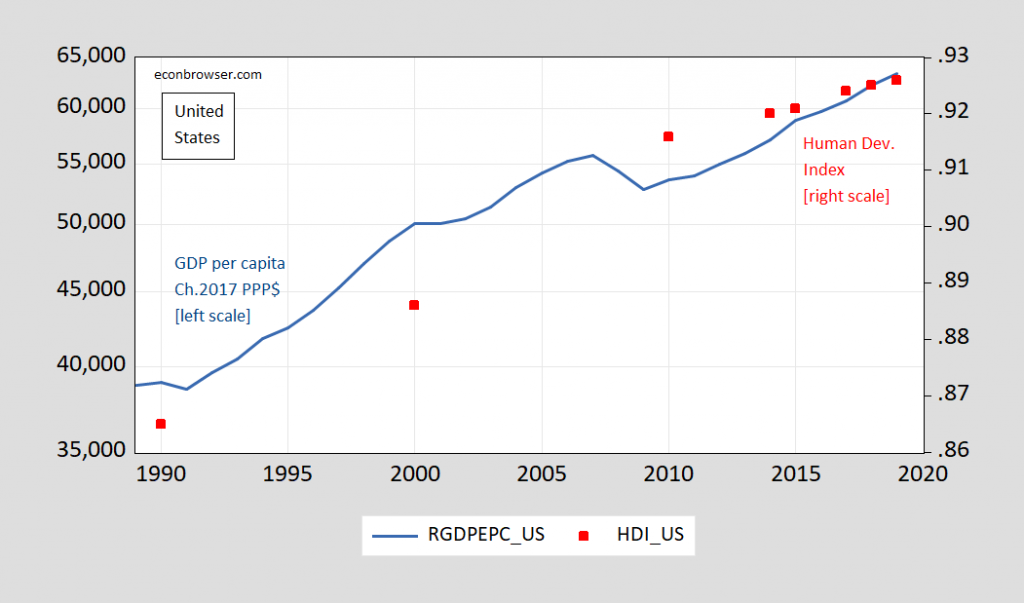
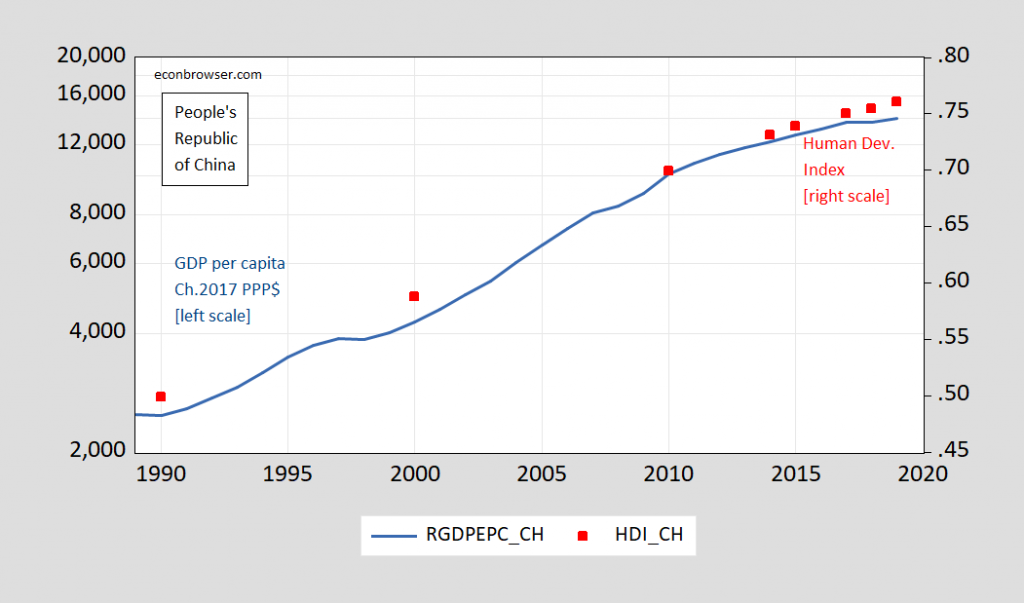
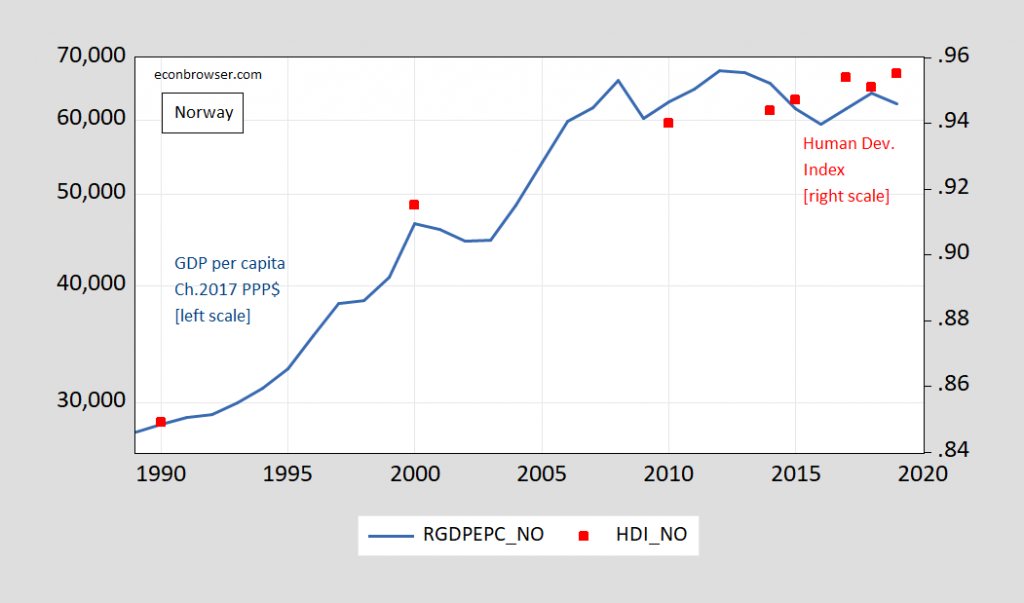
First I plot graphs for real GDP per capita and the Human Development Index for three countries: the US, China, and Norway (the highest-ranked in 2019 by the HDI).

Figure 1: US real GDP per capita, in PPP Chained 2017 US$ (blue, left scale), and Human Development Index for US (red square). Source: Penn World Tables 10.0, and UNDP.

Figure 2: Chinese real GDP per capita, in PPP Chained 2017 US$ (blue, left scale), and Human Development Index for China (red square). Source: Penn World Tables 10.0, and UNDP.

Figure 3: Norwegian real GDP per capita, in PPP Chained 2017 US$ (blue, left scale), and Human Development Index for Norway (red square). Source: Penn World Tables 10.0, and UNDP.
The HDI is briefly described thusly (2020 Technical Notes):
The Human Development Index (HDI) is a summary measure of achievements in three key dimensions of human development: a long and healthy life, access to knowledge and a decent standard of living. The HDI is the geometric mean of normalized indices for each of the three dimensions.
Graphically:

Source: UNDP (2020).
Note that per capita GNI (quantitatively similar to GDP usually) is a component of the HDI.
Obviously, the two series don’t comove exactly (as far as we can tell with these data). However, both per capita real GDP and the HDI co-trend. A naive regression of HDI on log per capita GDP for US and China yields a coefficient of about 0.15.

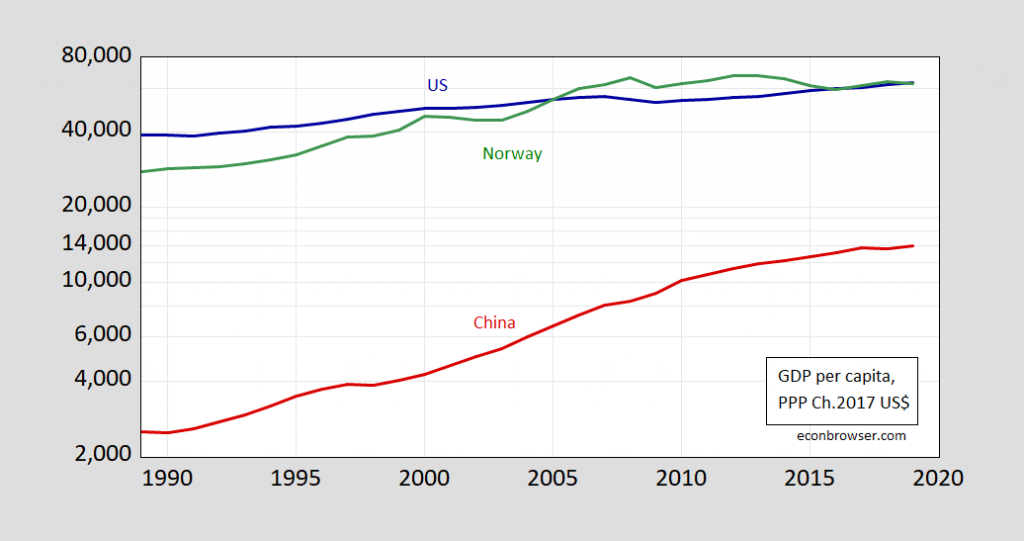
Figure 4: US real GDP per capita, in PPP Chained 2017 US$ (blue), Chinese (red), and Norwegian (green). Source: Penn World Tables 10.0.

Figure 5: US Human Development Index (blue squares), Chinese (red squares), and Norwegian (green squares). Source: UNDP.
So, now one knows – a broader measure of economic welfare typically co-trends, but there are surely deviations of one from the other; and cross-country comparisons of GDP per capita (even in PPP terms) and economic welfare will probably differ in terms of ranking.
I would not assert HDI is the best indicator; I’m only using it because it’s easily available and has been around for a long time. As the technical notes to the HDI lay out, there are additional versions, that account for income inequality and gender inequality, or focus on poverty.
There are innumerable papers on the subject of alternative means of measuring economic welfare. Rather than trying to cite most of them, I’ll refer the reader to one recent review (IMF, 2020). See also this review article by Dale Jorgensen, “Production and Welfare: Progress in EconomicMeasurement” (JEL, 2018).
Disclosure: None.


Quite educational, Thanks for the article.