
Following up on Friday’s post (“When is a recession not a recession?”) by Jan P.A.M. Jacobs, Samad Sarferaz, Jan-Egbert Sturm and Simon van Norden , here’s a picture in levels of some of the alternative GDP measures, along with two key variables followed by the NBER Business Cycle Dating Committee (aggregate hours, personal income excluding transfers), at the quarterly frequency.
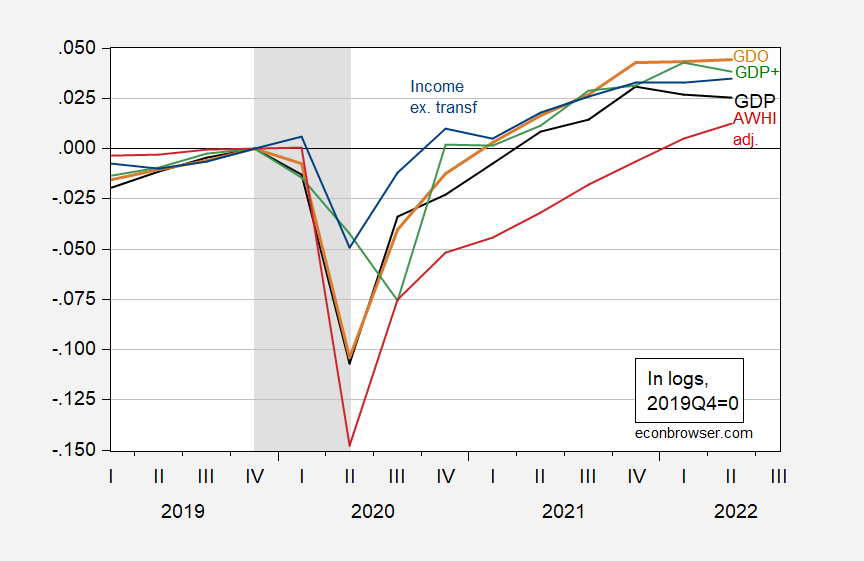
Figure 1: GDP (black), GDO (tan), GDP+ ( green), aggregate weekly hours index (red) and personal income excluding transfers (blue), all in logs 2019Q4=0. NBER recession peak-to-trough recession dates shaded gray. Note the Aggregate Weekly Hours Index has been adjusted to incorporate the preliminary benchmarked series, as discussed in this post. GDP+ converted to level using 2016Q1 as base, and subsequent growth rates. Source: BEA Q2 2nd release, Philadelphia Fed, BLS, NBER, and author’s calculations.
Note that I have not included GDP++. However, as noted by Jacobs et al., GDP++ matches GDO pretty closely for Q1-Q2 growth, so that you can infer roughly the same contours for GDP++ as for GDO shown above — i.e., weak but not negative growth.
GDPNow Q3 nowcast is 1.6%, St. Louis Fed is 0.9%, Goldman Sachs is 1.0% (all 8/26). Deutsche Bank forecast is at 2.8% (as of 8/26).
More By This Author:
Weekly Economic Activity Measures For The Week Ending Aug. 20Nonfarm Payroll Employment And Implications Of The Preliminary Benchmark Revision
GDP And Ten Year Yield Forecasts: Messages From The Survey Of Professional Forecasters


Comments
Log in or sign up to join the conversation.