GBTC Forming A Bullish Triangle

Image Source: Freepik
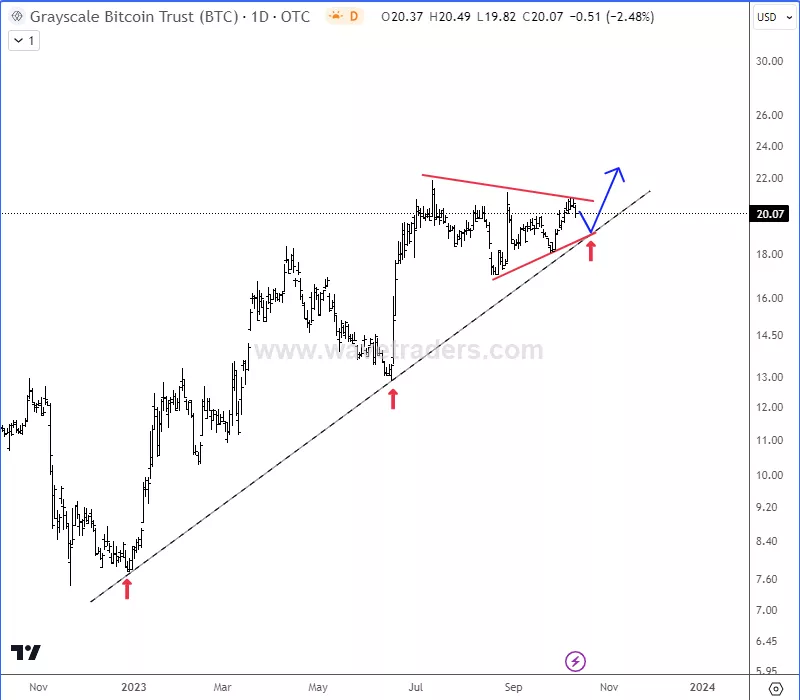
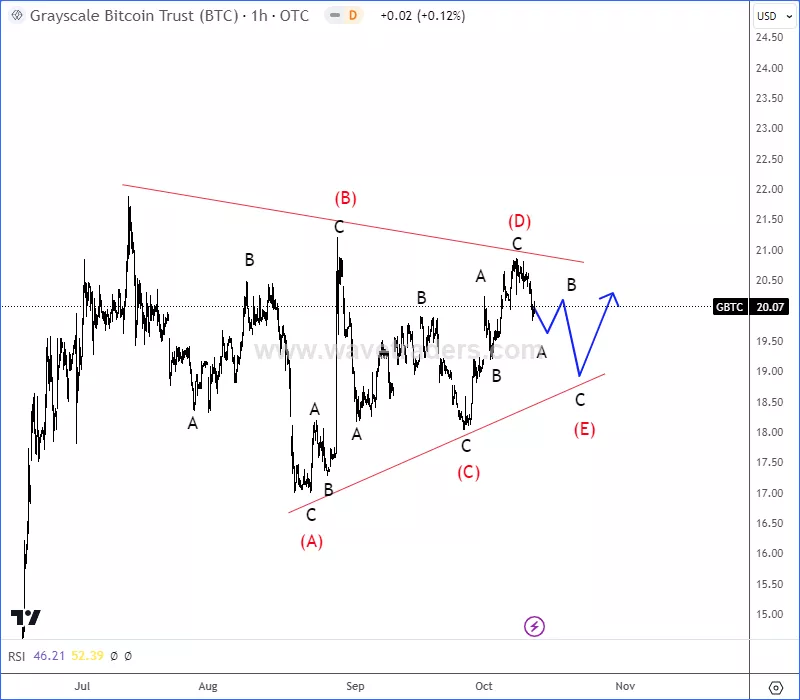
Bitcoin Grayscale Investment Trust with ticker GBTC is showing sideways corrective price action in the hourly chart, ideally a bullish triangle pattern that can take the Bitcoin price higher once it’s fully completed, especially if we consider a strong daily trendline support.

Triangles are overlapping five wave affairs A-B-C-D-E that subdivide 3-3-3-3-3 as an a-b-c. They appear to reflect a balance of forces, causing a sideways movement that is usually associated with decreasing volume and volatility. Triangles are very tricky and confusing. One must study the pattern very carefully prior to taking action. Prices tend to shoot out of the triangle formation in a swift thrust.

More By This Author:
Litecoin Is Eyeing 50-40 Support Zone
EURUSD Is Approaching Yearly Lows Support
Crude Oil May Stay In Recovery Mode
For more analysis visit us at www.wavetraders.com and make sure to follow us on Twitter (https://twitter.com/GregaHorvatFX)
For more analysis visit us at www.wavetraders.com and make ...
more


