

Image Source: Pixabay
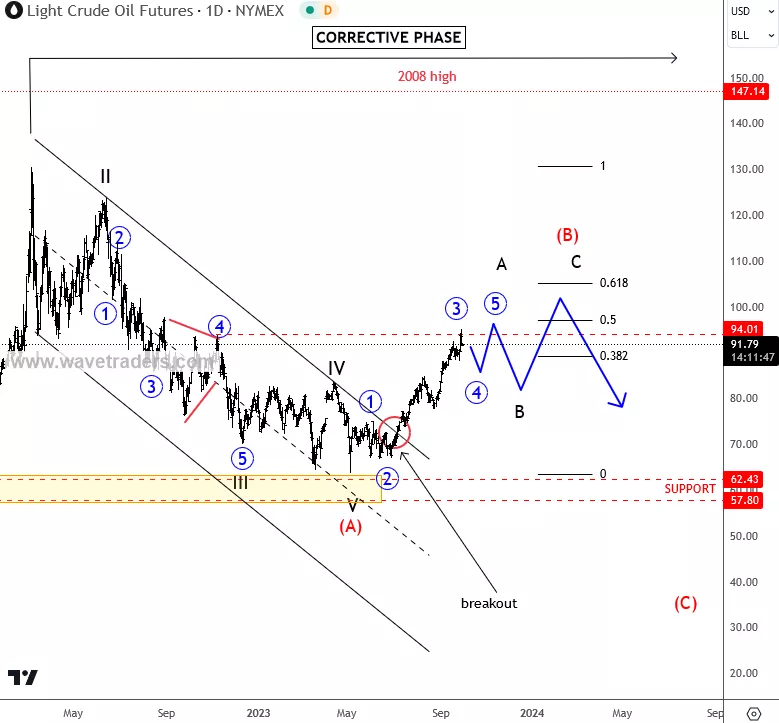
Crude oil is bullish when looking at monthly and daily charts, but we can see it now in a higher degree corrective slowdown.
On a daily chart, we see a drop on crude oil from 130 area as a five-wave impulse into wave A that bottomed at 62 – 57 support area. It was a strong drop and spike back in May, when energy bottomed, so we are tracking a higher degree correction from there; wave (B), which can be much higher than firstly thought. The reason is strong bullish trend from the last few weeks, which is looking impulsive, currently still with five waves in the making for wave A, so be aware of more gains after setback.
Crude Oil, Daily Chart
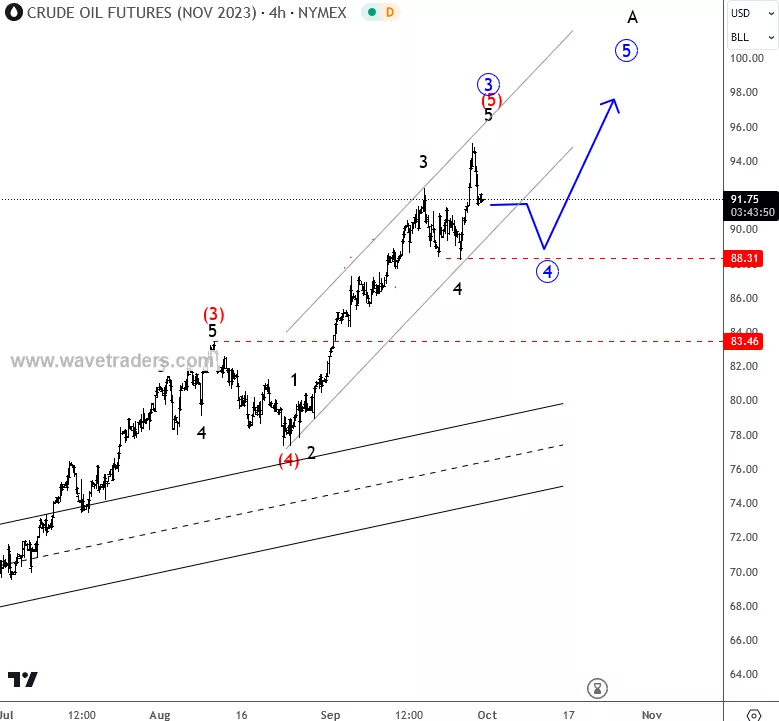
Looking a the 4h time frame, there can be some deeper pullback after the recent sell-off from 94-95 resistance area, so ideally wave (5) of extended wave 3 is coming to an end. Support on dips for next wave four is at 88.30, deeper level is 83.46.
Crude Oil, 4H Chart
We talked about the support and recovery on commodities already back on June 8, link here.
More By This Author:
Bitcoin Is Trading At Support Area
Gold Is Coming Lower Out Of A Triangle
NZDJPY Update: It’s Coming Into 90 Area


Comments
Log in or sign up to join the conversation.