

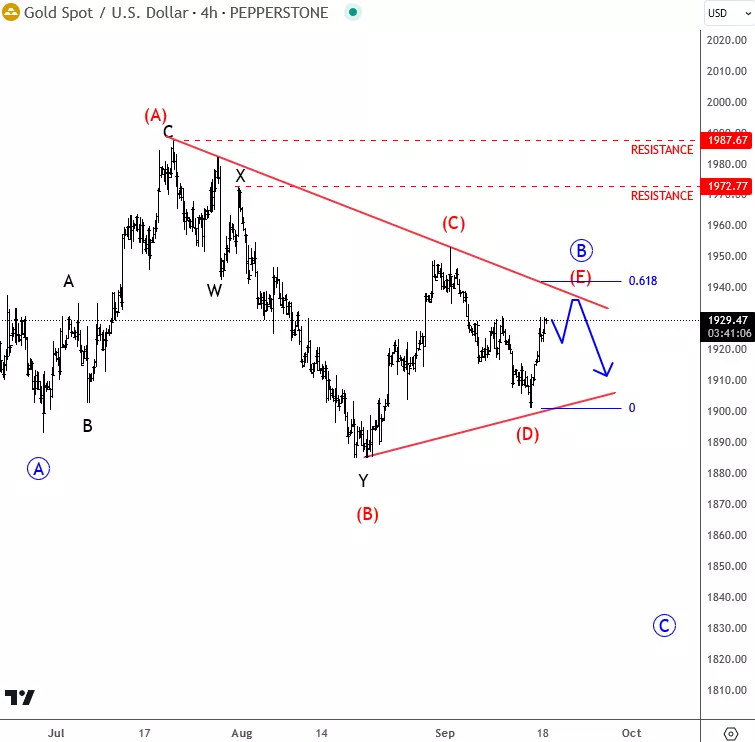
Gold was trading sideways through summer period, where we have been tracking a bearish triangle formation. On September 19 we also shared on article here on talkmarkets.com, where we mentioned and highlighted final wave (E) of a bearish triangle pattern in wave B.
GOLD 4H Chart From September 19
(Click on image to enlarge)
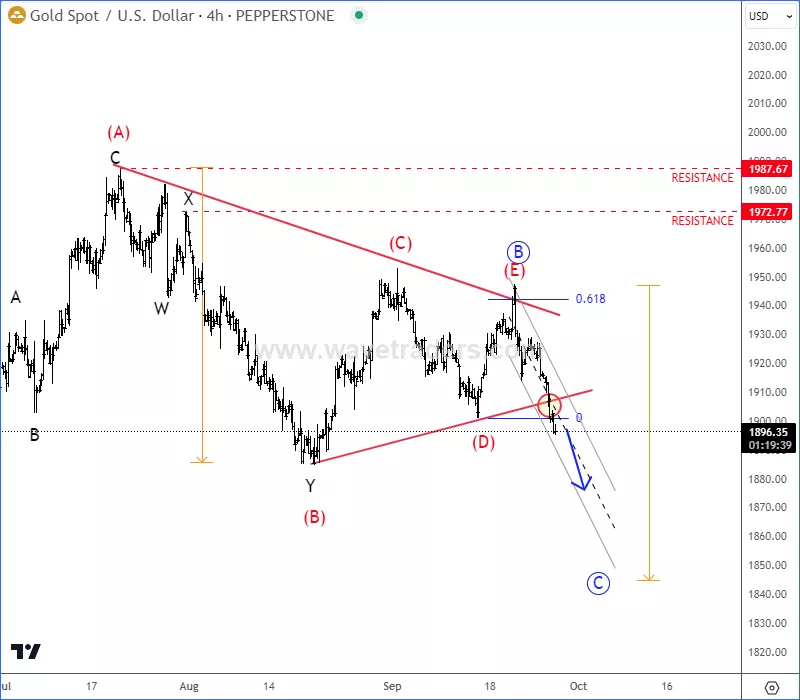
As you can see today, wave (E) stopped at the 61.8% Fib resistance from here we can see nice turn, below wave D and through the trendline support, so bears can be in control now. Therefore, be aware of a further weakness into wave C, below 1880 area.
GOLD 4H Chart From September 27
(Click on image to enlarge)
For more analysis visit us @ www.wavetraders.com
More By This Author:
NZDJPY Update: It’s Coming Into 90 Area
Kiwi Is Looking For Lower Support Levels
Ongoing Bearish Triangle In Gold



Comments
Log in or sign up to join the conversation.