

Image Source: Pexels
The view using CBO measures:
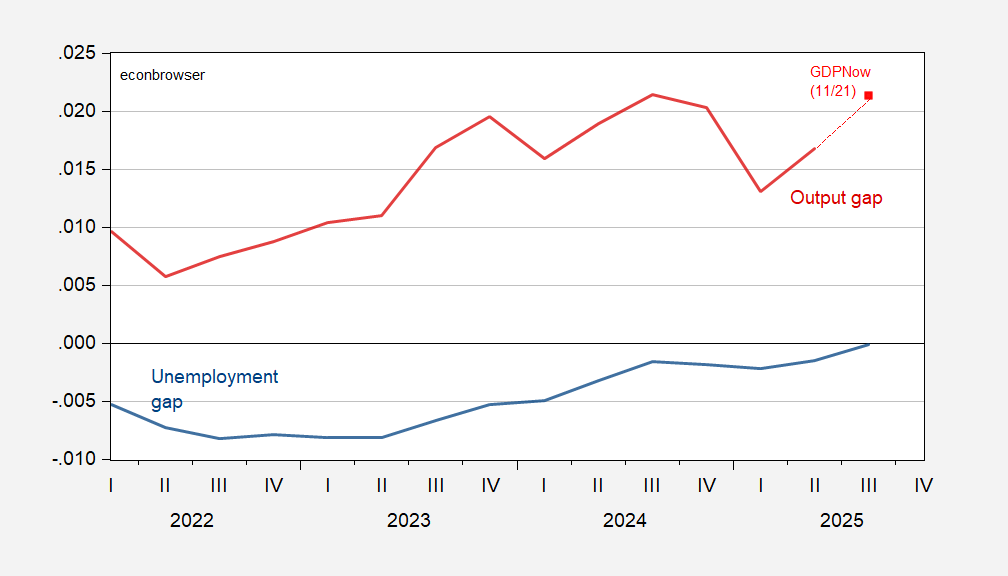
Figure 1: Unemployment gap (blue), and output gap (dark red), implied output gap using GDPNow (red square). Source: CBO (March), BEA, BLS via FRED, Atlanta Fed, and author’s calculations.
On the basis of this picture, a simple-minded interpretation of the Taylor rule would suggest a decrease in the policy rate is not warranted, using the output gap, and perhaps not warranted using the unemployment gap.
More By This Author:
Waiting For Data: Schedule And Alternative Business Cycle IndicatorsConfidence Collapse
Forward P/E Ratios – Mag 7 And Others


Comments
Log in or sign up to join the conversation.