

Image source: Pixabay
Talking about a rethink of the output gap, and the concept of the trend-cycle decomposition in macro policy tomorrow. Here’s a picture of the output gap from CBO, from two statistical filters (Hodrick-Prescott and Fleischman-Roberts/Fed Board), and the Delong and Summers (BPEA 1988) model.

Figure 1: Output gap calculated using CBO potential GDP (black), HP filter applied to 1960-2024 (tan), Fleischman and Roberts/Fed Board 2-sided filter (light green), and pseudo-DeLong-Summers (1988) approach (blue). NBER defined peak-to-trough recession dates shaded gray. Source: BEA 2024Q1 advance, CBO (February), Atlanta Fed Taylor Rule utility data accessed 4/26/2024, NBER, and author’s calculations.
Note that the HP filter yields implausibly small (in absolute value) output gaps in the wake of the Great Recession. On the other hand, both band pass filters like the Baxter King, or the Hamilton filter which relies on a regression method of extracting the trend, indicate big drops and jumps in the trend associated with the Covid-19 recession (not shown).
The CBO “production function” approach to estimating trends is not as affected by the COVID-19 shock and matches an economic interpretation better. However, it has been subject to substantial variation as estimates of productivity have shifted; and more recently, as immigration has affected the projected labor stock.
Jim Hamilton has a different interpretation of potential GDP which relies upon differentiated (by specialization) labor and capital supply and demand matching. Changes in the composition of demand relative to supply could then mean slack. However, I don’t have a time series of this interpretation of potential.
Another take on potential GDP is that we can’t take the usual trend-cycle decomposition for granted. Blanchard, Cerutti, and Summers (2015) argue that the trend and cycle might be correlated. They observe that trend growth in GDP has typically declined in the wake of recessions. This is not a natural outcome in the standard view of business cycles. For instance, in the CBO production function approach, a recession should only affect trend growth only to the extent that decreased capital investment and discouraged workers might reduce potential (presumably a small amount). In a cross-country analysis, they find that this is not the case.
I update the Blancard-Cerutti-Summers graph for the US, to include more of the post-Great Recession period, and the post-2020 recovery.
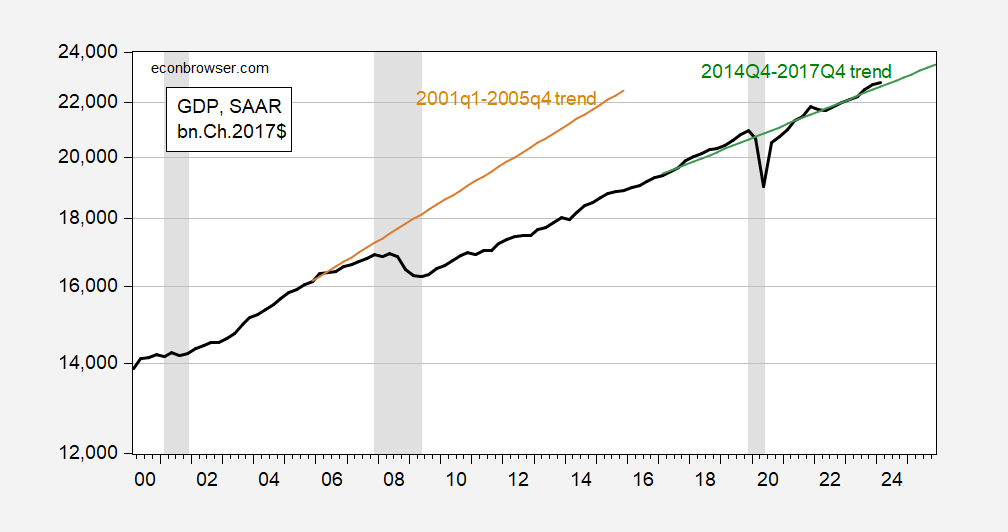
Figure 2: GDP (bold black), 2001-2005 linear trend (tan), and 2014-17 linear trend (green), all in bn.Ch2017$ on log scale. NBER defined peak-to-trough recession dates shaded gray. Source: BEA 2024Q1 advance release, NBER, and author’s calculations.
The BCS approach indicates a big mean and trend decline. The recession could’ve occurred because agents perceived an anticipated decline in the components of potential GDP (TFP, capital, and labor stocks) as conventionally conceived, or because of scarring due to a damaged financial system, along with a prolonged period of stagnant demand (due say to 50 Little Hoovers, including Wisconsin’s Governor Scott Walker).
Interestingly, the 2020 crisis has not apparently made a big impact on mean or trend GDP. This suggests that either the 2020 recession was not induced by a discrete downgrade in expectations regarding the components of potential GDP, or that scarring was avoided by prompt and energetic fiscal and monetary policies.
More By This Author:
U.S. Oil Production In 2023, Net Exports Of Petroleum Products Through 2024Q1Stagflation Fears? March NBER Business Cycle Indicators and Instantaneous Inflation
GDP, Nowcasts, And Est’d GDO, GDP+, And Final Sales


Comments
Log in or sign up to join the conversation.