
Forecasting The Future Via Most Recent CoT Report
Following futures positions of non-commercials are as of May 30, 2023.
10-year note: Currently net short 850.4k, up 78.8k.
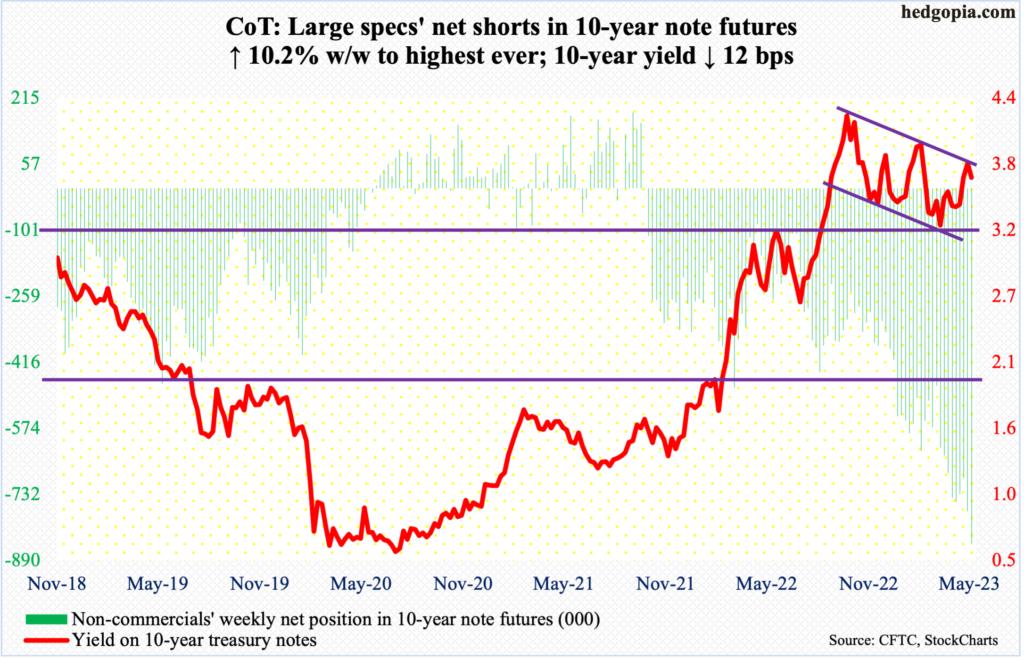
Non-commercials are hanging on to a losing trade.
The 10-year treasury yield retreated last October after touching 4.33 percent. Just a couple of months before that in August, rates were 2.53 percent and 1.68 percent in March. Going back further in time, the notes yielded 0.4 percent in March 2020. In other words, the 10-year yield had been riding an uptrend for a while and this probably ended October 21st when that high was made.
Non-commercials in the week to October 25 (last year) held 247,748 contracts in net shorts in 10-year note futures. They obviously were not in the camp that a lasting high was made in the rates last October. They have continued to add, with holdings reaching 850,421 contracts as of this Tuesday. This set a new record.
Increasingly, it feels like these traders at some point will end up covering their shorts, which in and of itself can put the yields under downward pressure. This will have added to factors that already point to lower rates in months/quarters to come.
The Federal Reserve is just tired of sticky inflation and a strong job market. The fed funds rate has gone up 500 basis points since March last year to a range of 500 basis points to 525 basis points. Yet, the job market is humming along, and inflation has a four to five handle versus the central bank’s two percent goal on core PCE (personal consumption expenditures). As things stand, a softer economy is the only way to put a dent in inflation.
In this environment, it is a safe bet to make that the 10-year yield saw a cycle high last October. This week, rates turned down at the top end of a descending channel from that high.
From non-commercials’ perspective – or other bond bears – the good thing is that 3.2 percent-3.3 percent is holding. Once this support gets breached, yields will come under renewed pressure, and this time around non-commercials could very well begin to cut short their net shorts.
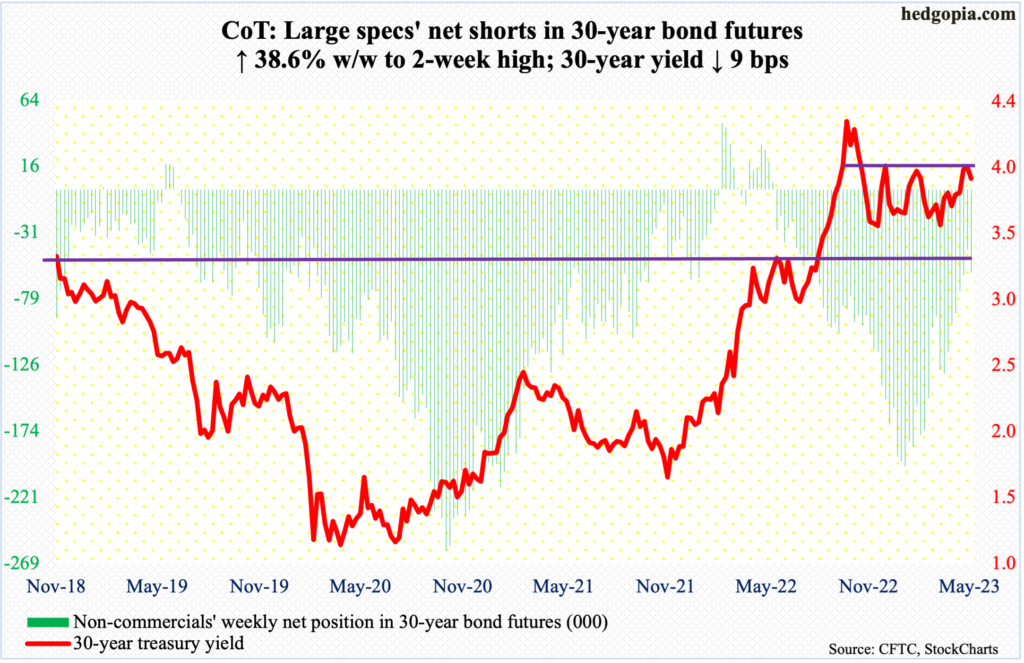
30-year bond: Currently net short 59.9k, up 16.7k.
Major US economic releases for next week are as follows.
Factory orders (April) and the ISM services index (May) are due out Monday.
Preliminarily, April orders for non-defense capital goods ex-aircraft – proxy for business capex plans – increased 1.4 percent month-over-month to a seasonally adjusted annual rate of $74 billion. This was a new record.
Non-manufacturing activity in April rose seven-tenths of a percentage point m/m to 51.9 percent – a two-month high.
Wednesday brings consumer credit (April). In March, it increased 7.3 percent year-over-year to $4.85 trillion (seasonally adjusted). This was made up of revolving credit that was up 14.1 percent to $1.24 trillion and non-revolving credit that was up 5.1 percent to $3.61 trillion. All three metrics set a new record.
WTI crude oil: Currently net long 187.6k, down 52.1k.
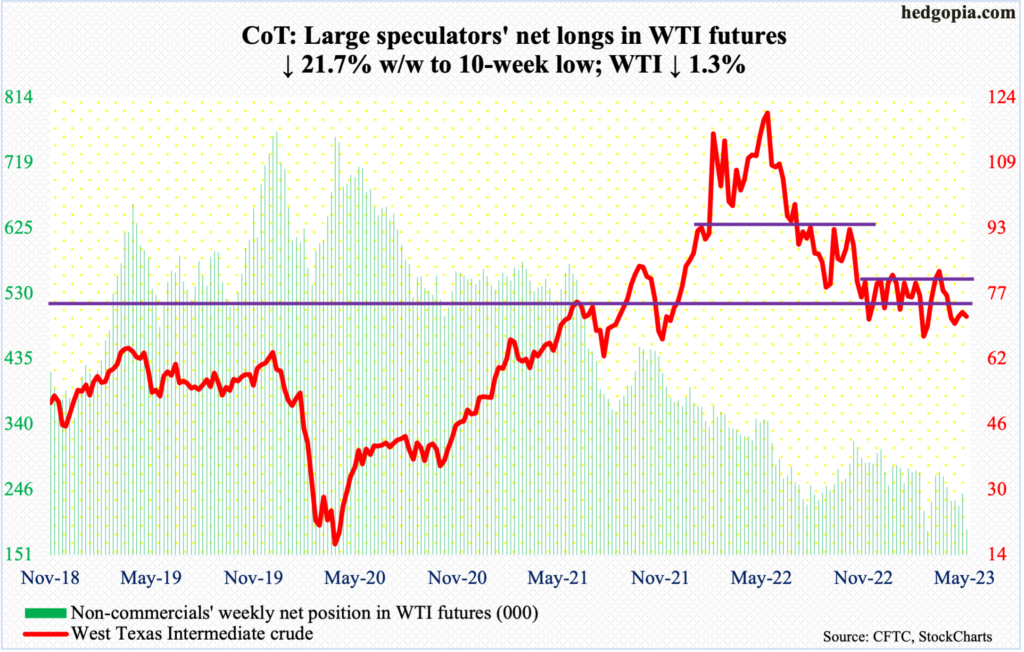
WTI ($71.74/barrel) dropped 1.3 percent this week to drop back into a six-month range between $71-$72 and $81-$82. On May 24, the crude rallied as high as $74.73, but only to get denied at the 50-day moving average (now $74.71).
From oil bulls’ perspective, the good thing is that horizontal support at $63-$64 is holding.
Immediately ahead, a rally toward the 50-day is possible, with the average approximating the daily upper Bollinger band; the lower band provided support this week, with the crude dropping to $67.03 intraday Wednesday.
In the meantime, as per the EIA, US crude production in the week to May 26 decreased 100,000 barrels per day week-over-week to 12.2 million b/d. Crude imports increased 1.4 mb/d to 7.3 mb/d. As did stocks of crude and distillates, which respectively grew 4.5 million barrels and 985,000 barrels to 459.7 million barrels and 106.7 million barrels. Gasoline stocks, however, declined 207,000 barrels to 216.1 million barrels. Refinery utilization rose 1.4 percentage points to 93.1 percent.
E-mini S&P 500: Currently net short 434.2k, up 29.9k.
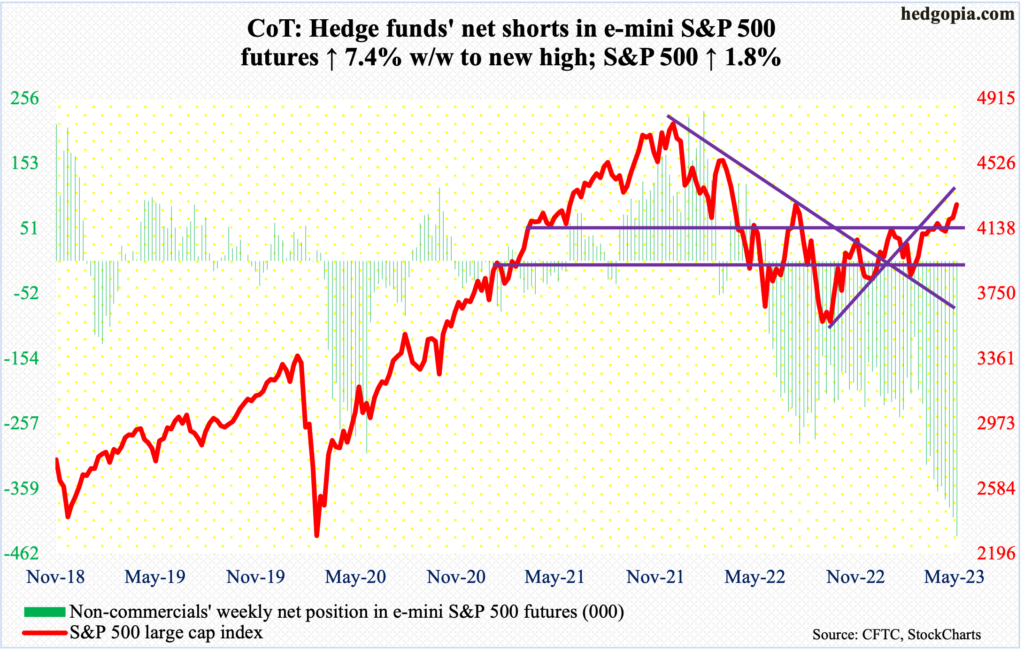
In the week to Wednesday, US-based equity funds drew $2.2 billion (courtesy of Lipper). This was the first time in seven weeks these funds experienced inflows. Even then, inflows were a pittance in the week to April 12 – a mere $53 million, which was the first positive flow in three weeks. The point is, outflows have occurred more often than inflows in recent months. Equity bulls hope the latest week is a sign of things to come.
Cooperation from fund flows can help them build on recent weeks’ gains. This week, they took out 4200 on the S&P 500. Before that, 4170s fell and 4100 before that. Right here and now, bulls have a shot at 4320s, which represent both a high from last August and the underside of a broken rising trendline from last October’s low.
Longs are salivating over the prospects of a short squeeze. Non-commercials again added this week to accumulate most net shorts ever in e-mini S&P 500 futures. If fund flows continue to cooperate and margin debt joins in, the possibility of a squeeze cannot be denied. But it is also important to remember that the bulls have already spent a lot of currency. The S&P 500 bottomed at 3492 last October and ended this week at 4282.
It is too soon to pooh-pooh non-commercials. They may very well have the last laugh. Time will tell.
Euro: Currently net long 165.7k, down 8k.
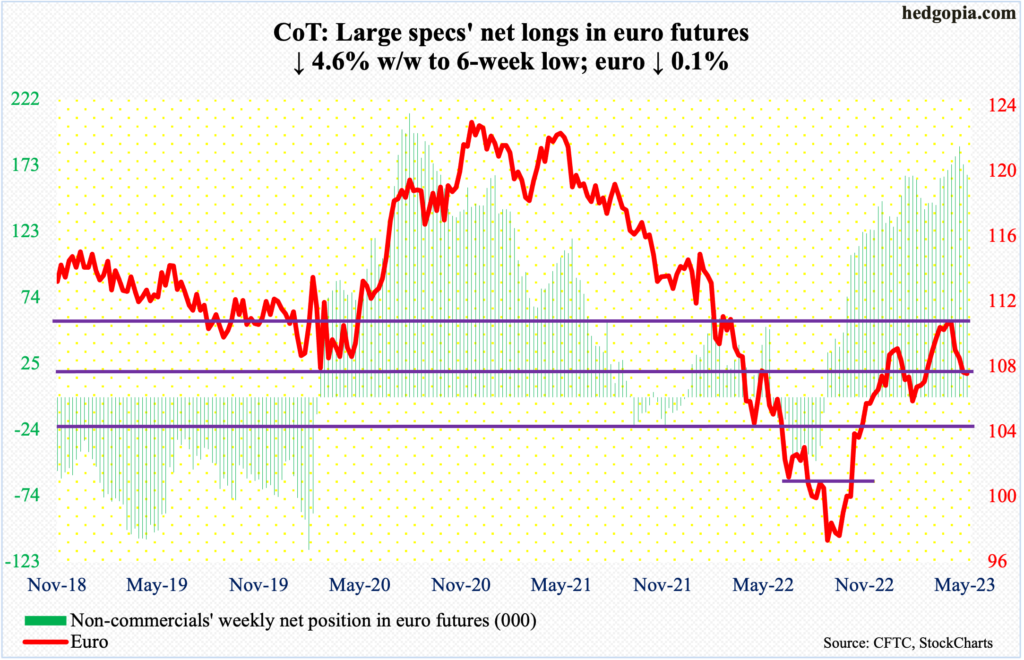
Rejection at horizontal resistance at $1.09-$1.10 is proving costly for euro bulls. The currency tagged $1.1095 six weeks ago, followed by $1.1092 the week after that, before coming under pressure the last four weeks.
This week, it edged lower 0.1 percent to $1.0717, but could have been worse. In Wednesday’s spinning top session tagging the daily lower Bollinger band, it fell as low as $1.0635. This should be viewed as a successful test of lateral support at $1.07-$1.08. A breach opens the door toward $1.04-$1.05, which has been an important level going back at least eight years and which was reclaimed last December and has not been tested since.
Gold: Currently net long 169.3k, up 8.6k.
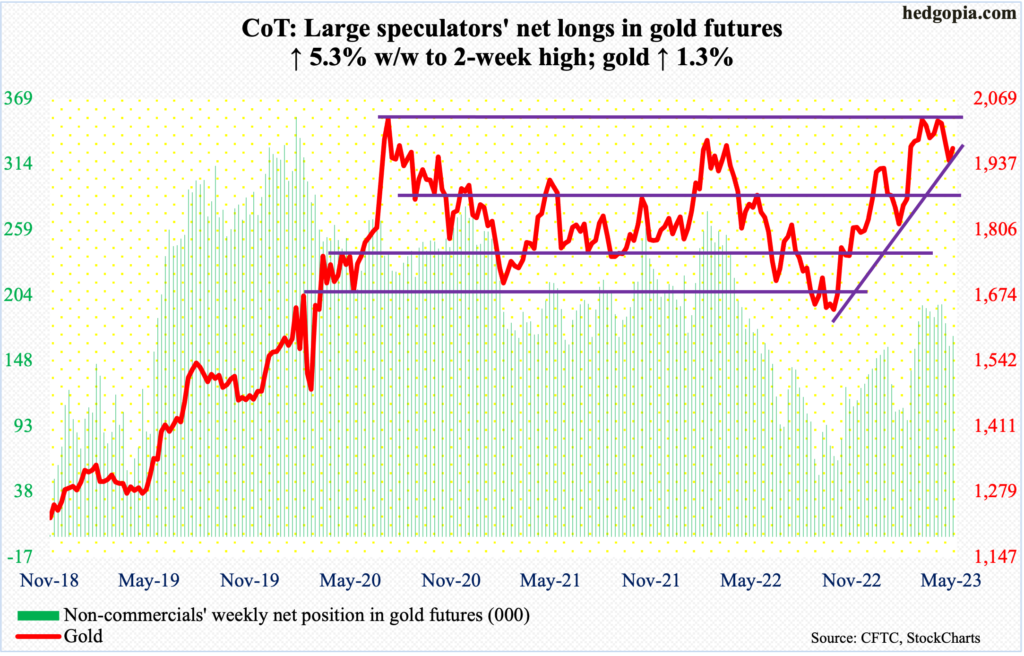
After three consecutive down weeks, gold had a good week, up 1.3 percent to $1,970/ounce, but at the same time left a long upper wick on the weekly, as gold bugs were unable to hold on to Thursday’s intraday high of $2,001.
Besides being the round number $2,000, Thursday’s high also touched the 50-day; the metal lost the average on May 17 and has not traded back above since.
Earlier on May 4, in a spinning top session, gold touched $2,085 but only to soon come under pressure. In the past, it tagged $2,089 in August 2020 – an all-time high – and $2,079 in March 2022. Bulls tried several times, but these levels kept attracting offers.
Both this week and last, a rising trendline from last October when gold bottomed at $1,620s was saved. A breach of this trendline can lead the yellow metal hurriedly head toward $1,920s, which is a must-hold for the bulls.
Nasdaq 100 index (mini): Currently net long 8.5k, down 6k.
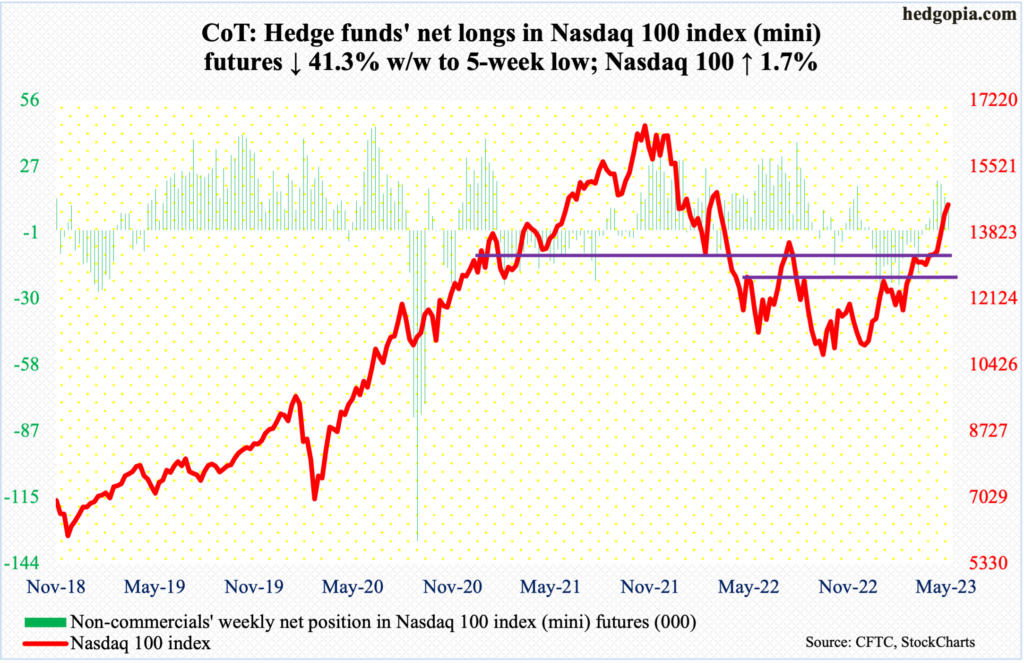
Tech is where all the action is currently. Yes, the rally is led by the select few, with the top five US stocks being all tech and them enjoying an ordinate amount of influence in market cap-weighted indices such as the Nasdaq 100 and the S&P 500 (more on this here). And yes, the Nasdaq 100 is grossly overbought. But, as they say, price trumps everything, and on this score, there are no complaints.
This week, the Nasdaq 100 added 1.7 percent, coming on the heels of gains of 3.6 percent last week and 3.5 percent before that. For the year, the tech-heavy index is up 33 percent, erasing last year’s loss of the same magnitude.
The Nasdaq 100 just about went parabolic once 13100s fell. This level held the index down for four weeks before it poked its head out six weeks ago. This week’s strength puts the index (14547) squarely on potentially important 14500s channel resistance. Inability to soak up all the offers that are likely to come their way can begin a process of unwinding the overbought condition the index is in.
Russell 2000 mini-index: Currently net short 63.1k, up 14.2k.
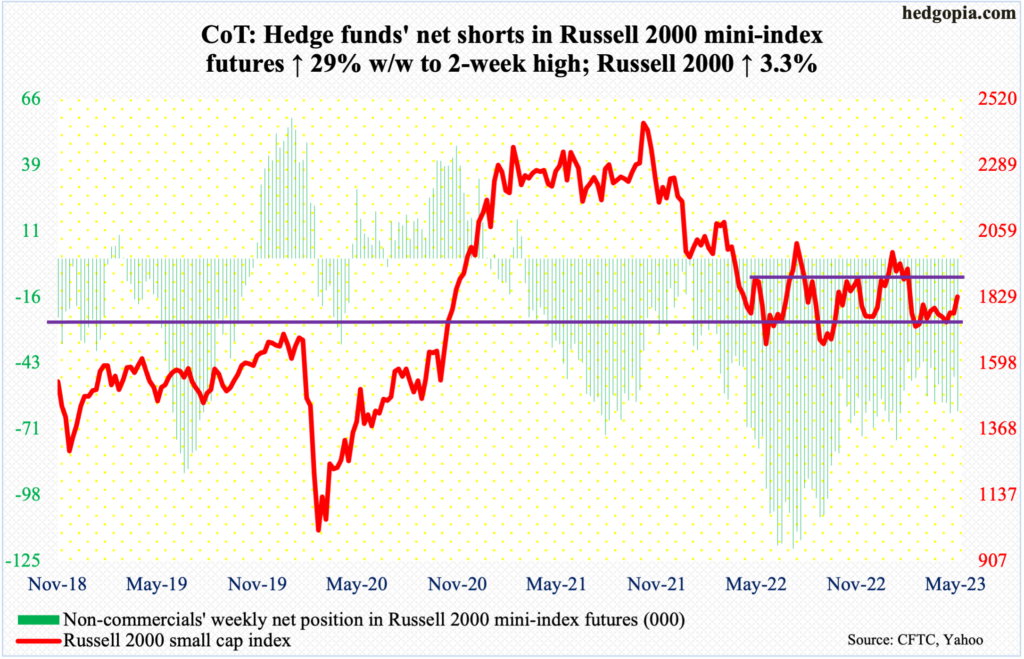
At long last, small-cap bulls pushed through the 1800 range resistance, closing the week out at 1831. For nearly three months now, this price point repelled rally attempts. There is a bigger hurdle ahead if the Russell 2000 were to genuinely signal a trend change.
Since January last year, the small cap index has gone back and forth between 1900 and 1700, with support at the latter going back to August 2018.
Small-caps inherently have a larger exposure to the domestic economy than their mid- and large-cap brethren. Friday’s 3.6-percent jump in the Russell 2000 followed a blockbuster, higher-than-consensus addition of 339,000 non-farm jobs in May.
How the index proceeds toward 1900 and how it acts around that level will be a tell.
US Dollar Index: Currently net long 12.8k, up 1.5k.
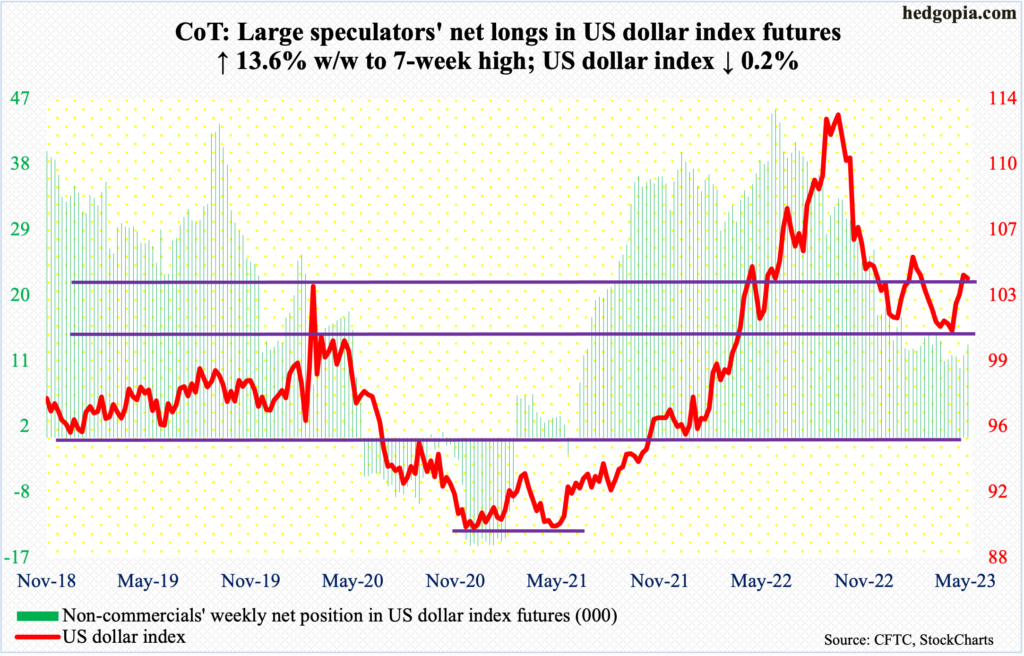
Last week, the US dollar index rallied one percent to close at 104.14. It was difficult to label it a decisive breakout at 103-104, which was lost mid-March. Turns out it was far from decisive, ending this week at 103.95, down 0.2 percent, with a high of 104.61 on Wednesday and a low of 103.32 on Friday.
Dollar bulls can still salvage the situation. A failure to do so can make the index vulnerable to a drop toward 100-101, wherein lies eight-year horizontal support.
VIX: Currently net short 62.5k, down 2.2k.
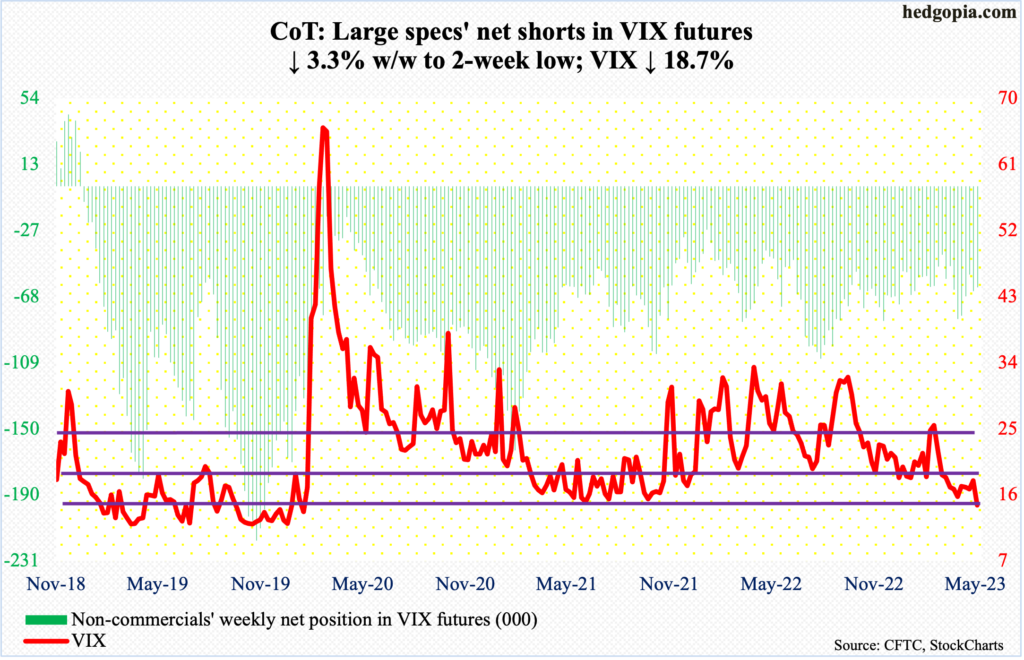
As equity bulls went on a rampage on Friday, VIX sliced through 16, ticking 14.42 intraday and closing at 14.60. If volatility bulls cannot save this level, the next level of decent support lies at 11-12.
Amidst this, there are signs of elevated optimism in the options market. In eight of the last 10 sessions, the CBOE equity-only put-to-call ratio printed 0.50s, with two in the high-0.50s and six in the low- to mid-0.50s. Not saying we are there already, but this is how investor sentiment gets dangerously exuberant.
Thanks for reading!
More By This Author:
Tech Leads, Small-Caps Lag; Nasdaq 100-Russell 2000 Ratio Nearing March 2000 Record High
Peering Into The Future Via CoT Report Of The Week
S&P 500 Up 21% From Last Oct’s Low


