

Image source: Pixabay
But convergence in the East North Central portion of the Midwest is slower. Follow up to this post.
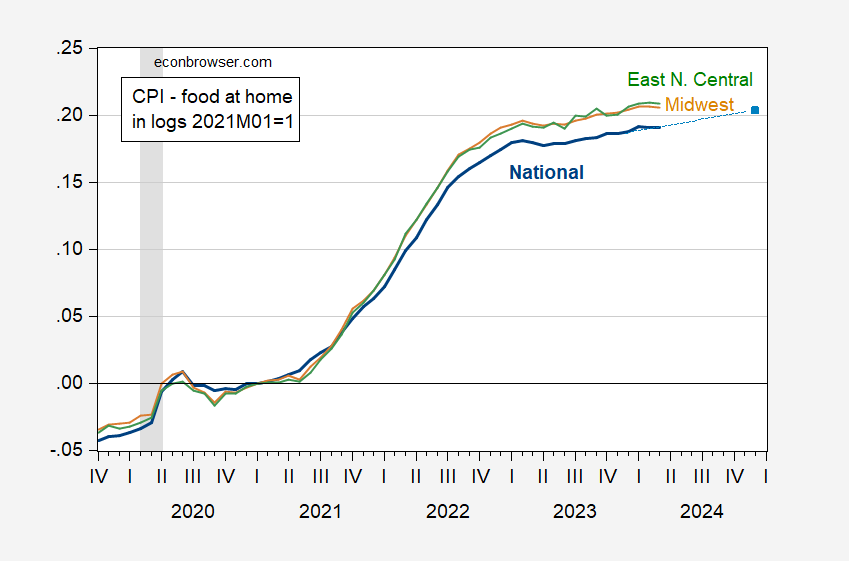
Figure 1: CPI – food at home nationwide (bold blue), ERS forecast of February (light blue square), Midwest B/C cities (tan), East North Central (green). Midwest and East North Central series seasonally adjusted using X-13. NBER defined peak-to-trough recession dates shaded gray. Source: BLS, ERS, and author’s calculations.
Food at home prices have risen faster than the CPI overall, both nationwide and in the MIdwest. However, the convergence has proceeded faster nationwide (mostly my overall CPI rising faster).
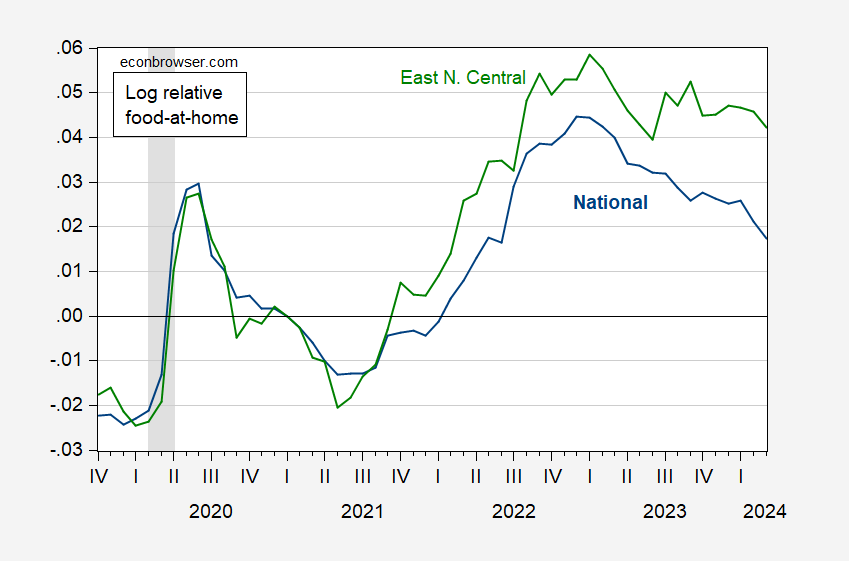
Figure 2: Log ratio of CPI – food at home to overall CPI nationwide (bold blue), for East North Central (green). East North Central series seasonally adjusted using X-13. NBER defined peak-to-trough recession dates shaded gray. Source: BLS and author’s calculations.
More By This Author:
Instantaneous CPI, PCE deflator, And PPI Inflation In MarchInflation Surprise
Studies in Sophistry: Rich States, Poor States 17


Comments
Log in or sign up to join the conversation.