XLF Incomplete Sequences Calling The Drop Toward Blue Box Area
Hello fellow traders. In this technical article we’re going to take a look at the Elliott Wave charts charts of XLF ETF published in members area of the website. As our members know XLF is giving us pull back against the May 3rd low. Correction made clear 3 waves from the peak and reached the Equal Legs zone. In further text we’re going to explain the Elliott Wave forecast.
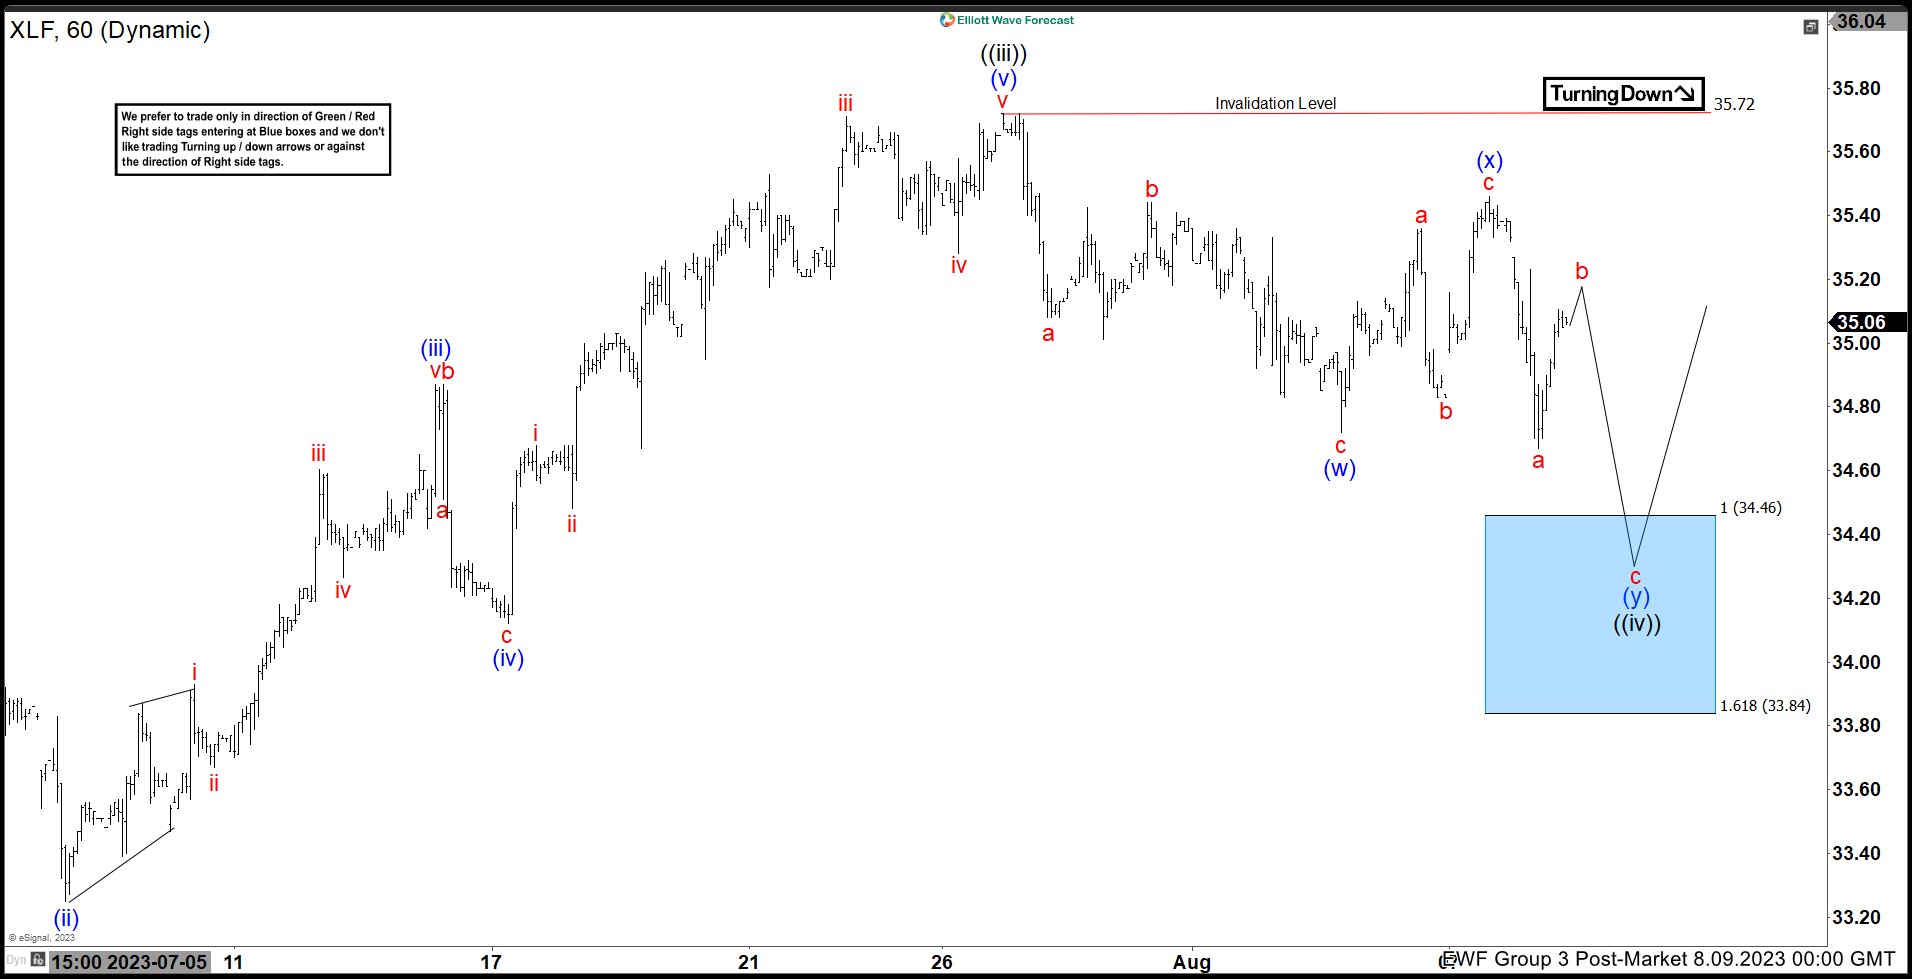
XLF Elliott Wave 1 Hour Chart 08.09.2023
Current view suggests the price is doing wave ((iv)) pull back. The ETF is showing incomplete sequences in the cycle from the 35.72 peak. At the moment we can count 5 swings down from the peak, which is incomplete structure. As far as the price stays below (x) blue high : 35.47 , we expect to see further extension down in 7th swing, targeting 34.46-33.84 area.
(Click on image to enlarge)
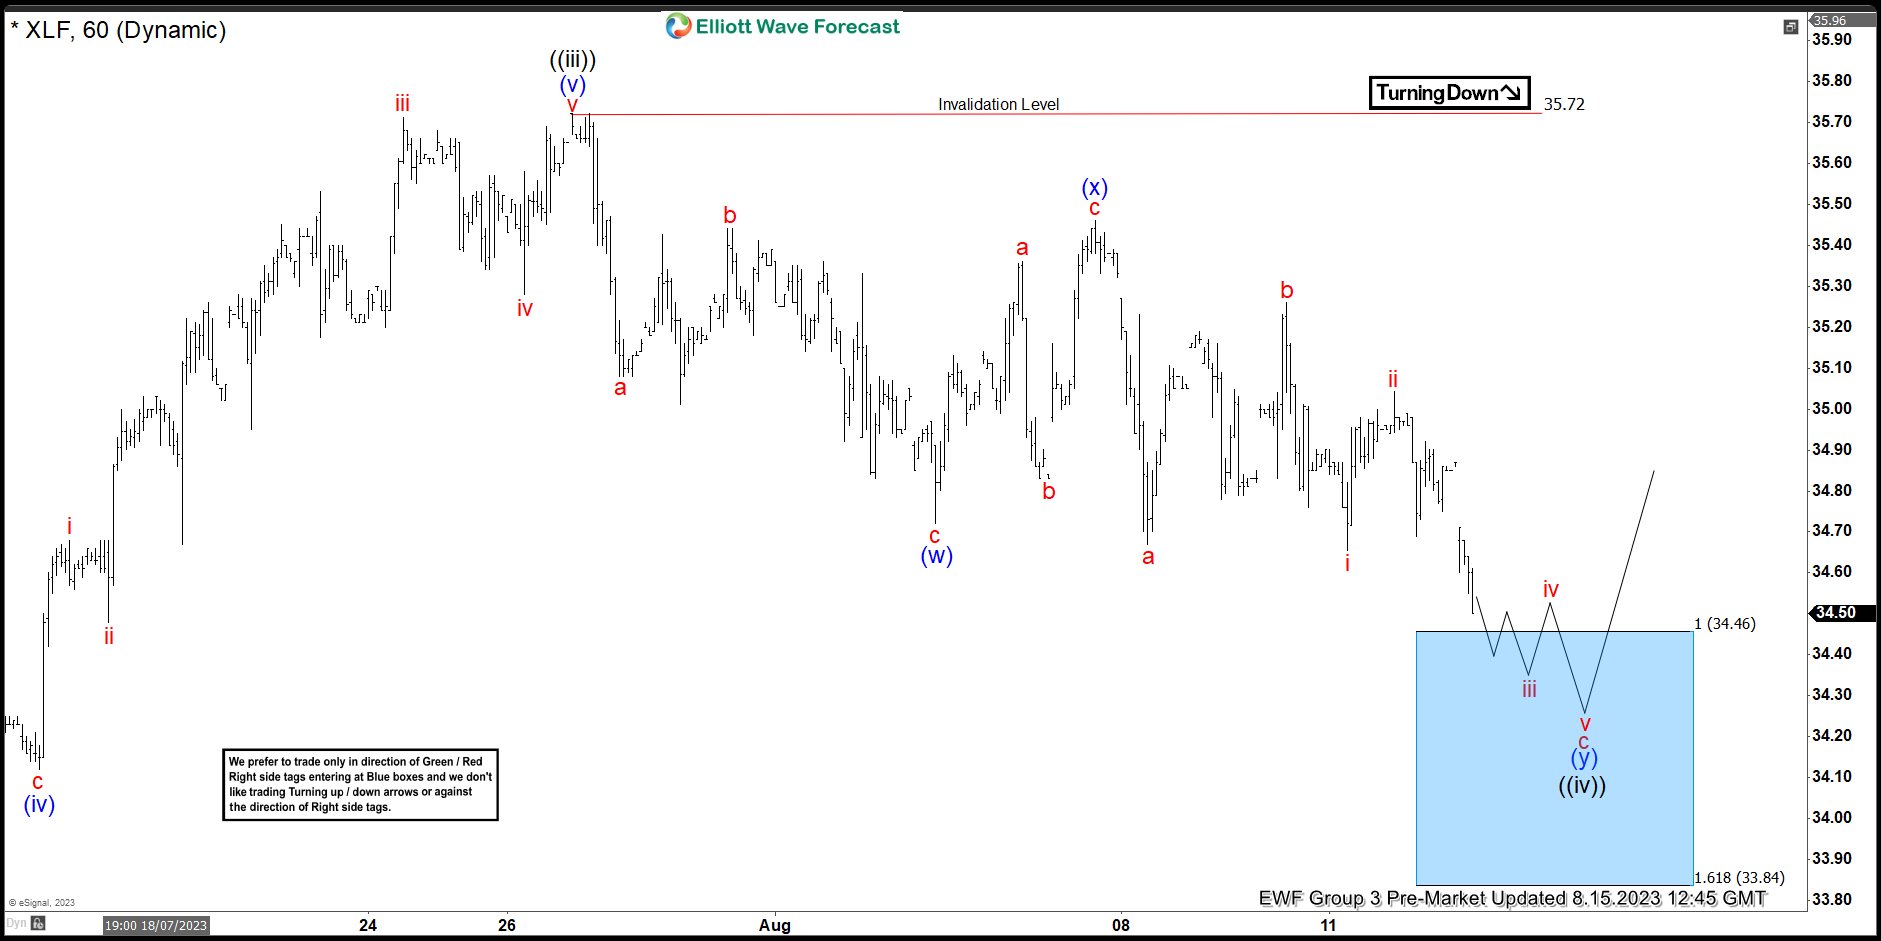
XLF Elliott Wave 1 Hour Chart 08.09.2023
The price held below 35.47 high and we got the decline as expected. Short term b red recovery ended at 35.25 as 3 waves. At the moment the price is approaching first target at 34.46. Current wave count suggests we are in c red of (y) blue which can keep trading lower toward extreme zone 34.46-33.84. From that zone we can see turn higher again in 3 waves bounce at least. The break below 33.84 would invalidate the count.
(Click on image to enlarge)
More By This Author:
Eli Lilly & Company (LLY) Remains Supported In Bullish sequence
Caterpillar Shows Incomplete Bullish Structure
Nvidia Corp. Found Buyers After A Corrective Pull Back.
Disclaimer: Futures, options, and over the counter foreign exchange products may involve substantial risk and may not be suitable for all investors. Leverage can work against you as well as for ...
more


