Caterpillar Shows Incomplete Bullish Structure
Caterpillar (CAT) is one of the largest and most recognizable names in the heavy equipment industry. It produces a wide range of machinery used in construction, mining, agriculture, and various other industries. In this article, we will look at the Elliott Wave chart to see why the stock should continue higher in coming weeks.
Caterpillar (CAT) Weekly Elliott Wave View
(Click on image to enlarge)
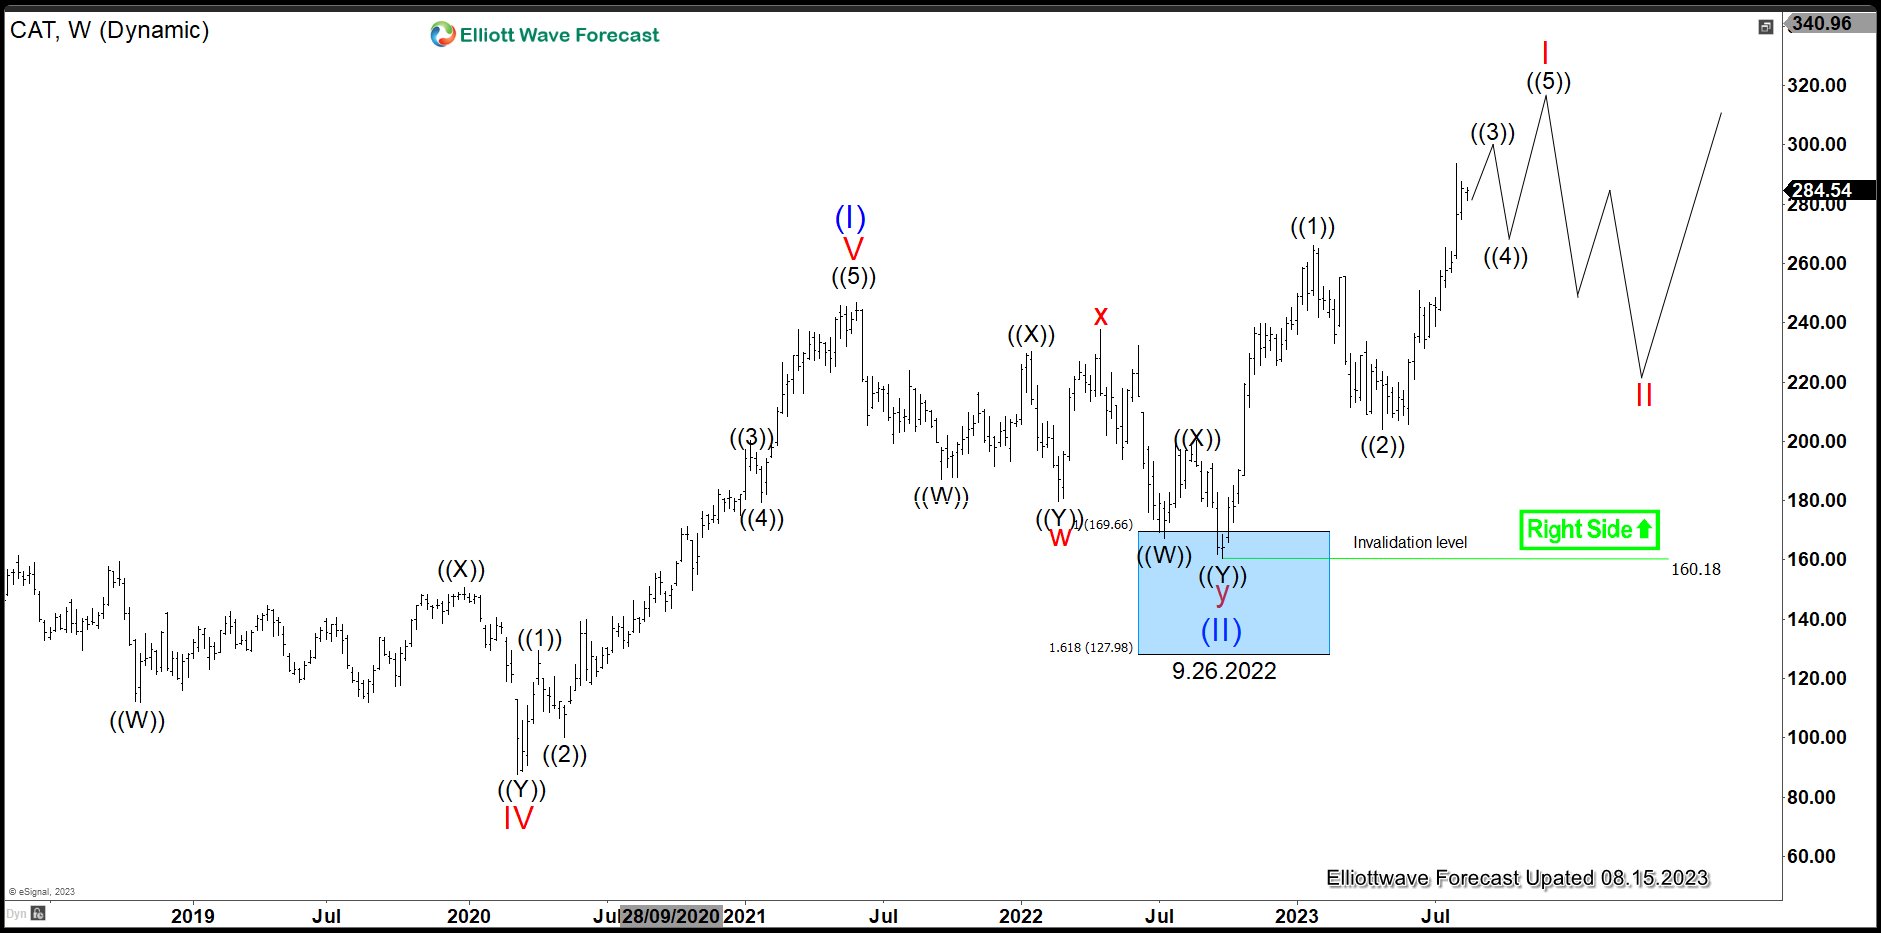
Weekly Elliott Wave Chart of Caterpillar (CAT) above shows that the stock found buyers at the extreme blue box area on September 26, 2022. It ended wave (II) at 160.18 and the stock has since resume higher and made new all-time high. The rally from 9.26.2022 low so far is only in 3 swing and no bullish and impulse structure ends in 3 waves. Thus, $CAT is telling us that the rally is incomplete and we won’t see crash in $CAT or broader Index anytime soon. Expect pullback in $CAT to find support in 3, 7, or 11 swing against 160.18 for further upside until we see at least a clear 5 waves.
More By This Author:
Nvidia Corp. Found Buyers After A Corrective Pull Back.GDX Lower Low Sequence Supports More Downside
Oil Impulse Sequence Supports More Upside
Disclaimer: Futures, options, and over the counter foreign exchange products may involve substantial risk and may not be suitable for all investors. Leverage can work against you as well as for ...
more


