
Bitcoin Price Momentum Strategy Since The Halving In 2020
I began gathering price data from June 1st, 2020 till end of April, 2024, following the halving event in May 2020. After cleaning the data and analyzing its characteristics, including autoregressiveness, I experimented with momentum strategies across different timeframes, adjusting hurdle rates, and refining my approach through 60 iterations with rolling forecast origins to ensure precision in observations.

At the very beginning, some good amount of time is spend to verify and ensure the data points grabbed from FS formulas are pointing to the exact time stamp to the precision of hours.
Comparing the screenshot query from CM directly
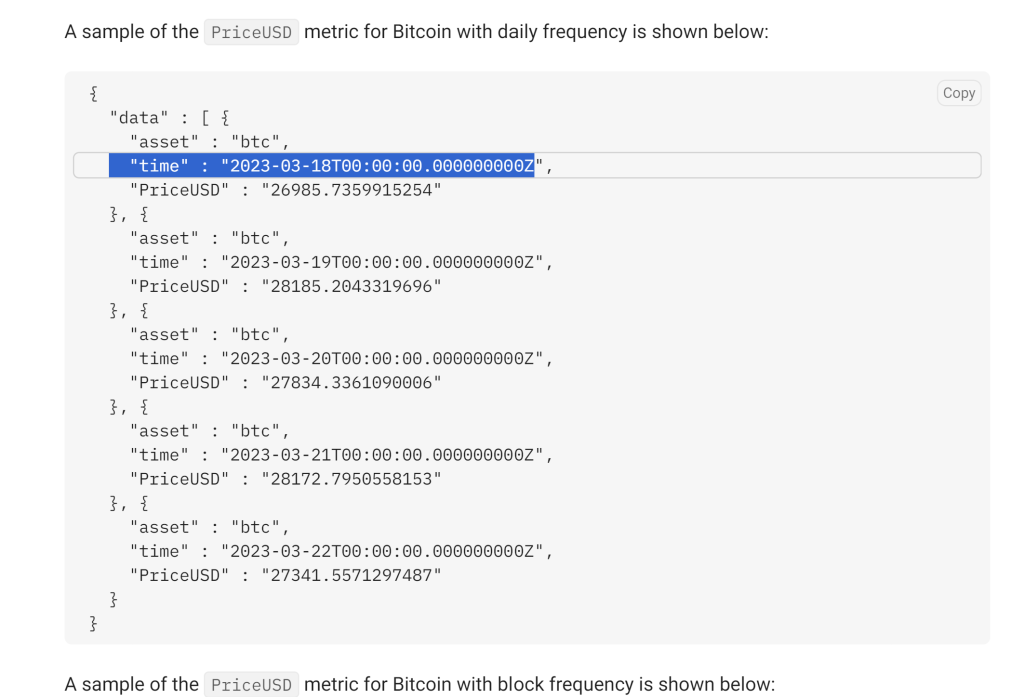
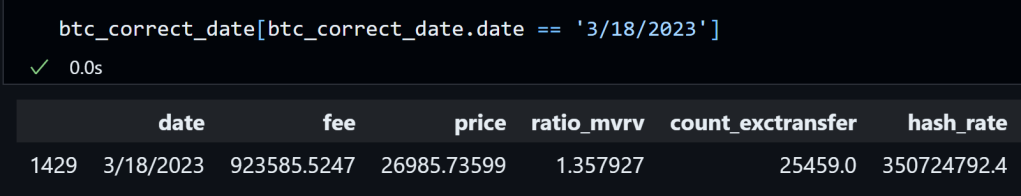
Now it’s concluded the date is pointing to UTC 00:00 at the very beginning of that day of the row of metrics including price.
First, after converting direct price data points to daily return, then standardize, winsorize with 95% confidence interval, checked the stationarity using Augmented Dickey Fuller test, confirmed it’s stationary.
Second run adf test and draw the ACF and Partial ACF plots as below
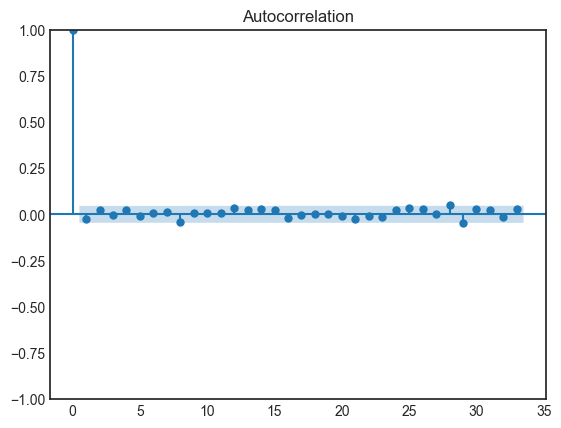
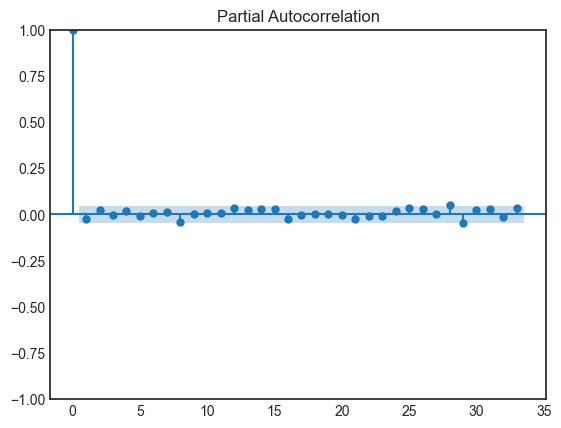
There is no statistically significant autoregressiveness at all.
However, given the high volatility and relatively short history of crypto currencies, I speculate that the momentum strategy could still work. Why?
A momentum strategy typically involves buying assets that have had high returns over a past period (winners) and selling those that have had poor returns (losers). This strategy is predicated on the empirical observation that asset prices that perform well in one period can continue to perform well in the next period and vice versa.
- Different Drivers: Momentum and autocorrelation measure different characteristics of asset prices. Autocorrelation checks for a linear relationship between consecutive price levels or returns, directly evaluating the predictability of returns from their own historical values. Momentum, however, capitalizes on continuation of trends which might not strictly be linear or might be driven by factors such as behavioral biases, investor sentiment, or reactions to news and events, where the asset’s price response may be stretched over time.
- Behavioral Factors: Momentum strategies often exploit behavioral biases such as anchoring, herding, and the slow diffusion of information across the market. Investors might be slow in reacting to new information, leading to trends persisting longer than they “rationally” should.
- Multi-Factor Influence: Asset prices are also influenced by numerous other factors including macroeconomic indicators, changes in market conditions, and sector-specific news which are not captured solely by autoregressive components. Momentum might capture these aspects by identifying the relative performance of securities.
Market Efficiency and Risk:
- Efficient Markets: In highly efficient markets, finding consistent alpha might be more challenging as prices quickly adjust to reflect new information. Yet, even in efficient markets, anomalies (like momentum) can exist due to the aforementioned behavioral factors.
- Risk and Volatility: Momentum strategies can expose investors to higher risk and volatility. It’s important to manage risk appropriately, possibly using stop-loss orders or adjusting the asset allocation based on broader market conditions.
Now testing below Momentum strategies: starts with $1 million cash of capital, set various period: 7day, 14days, 1month, 3month, 6month, then compute momentum score as the price at the end of period/beginning of the period -1, if the score is higher than the hurdle rate, set to be 0.1, buy bitcoin at that price, if less or equal to 0.1, sell.

1month and 14day momentum strategies out-performed Bitcoin performance and moreover the volatility and drawdown risk is diminished.
To ensure the accuracy of this observation, I applied rolling forecast origins, fix the whole testing period, varying starting at (start=’2020-06-01′, end=’2020-07-30′) and ending at (start=’2024-03-01′, end=’2024-04-30′), iterating 60 various origins.
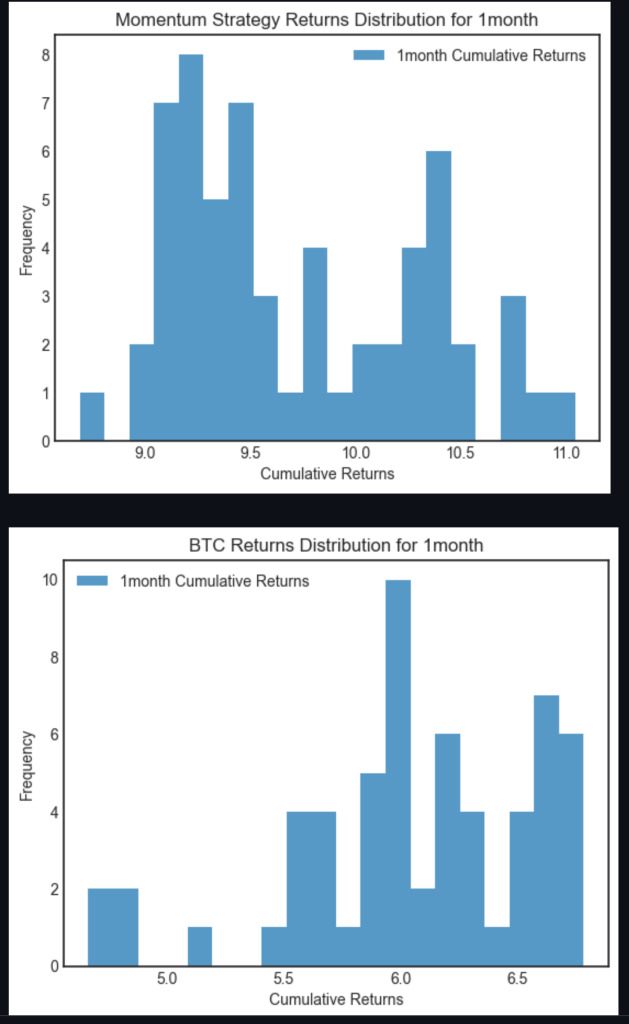
1month strategy yields stronger return compared to BTC.

14day Momentum strategy has comparable return as BTC but still is a good option since it’s downside is trimmed.
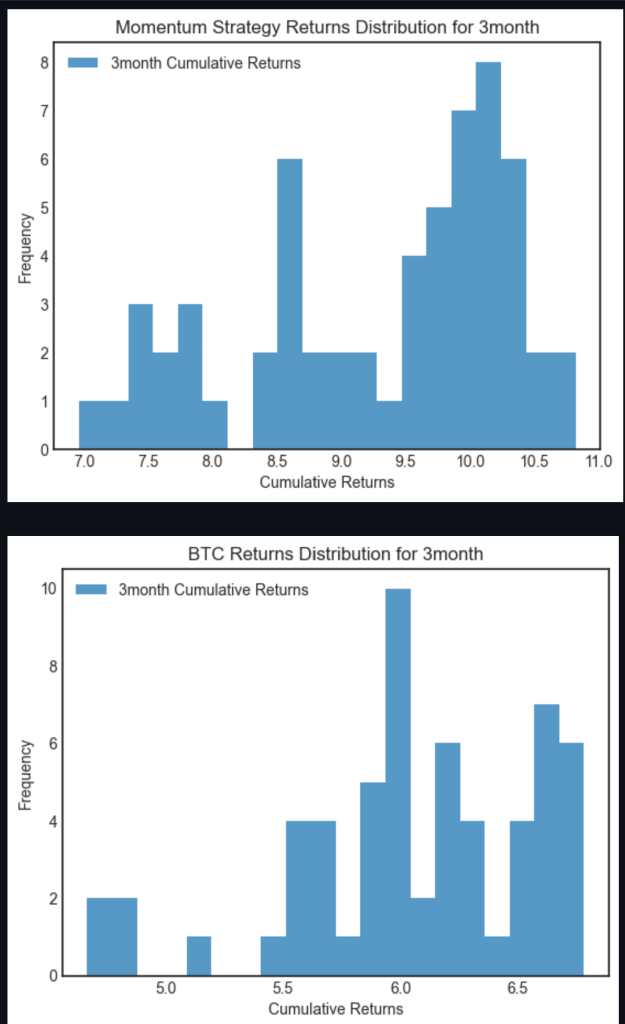
3month also worked well but not for 6month.
More By This Author:
The Unthinkable Phenomena Will Be a New Norm – Negative Interest Rate
The Landscape Of Biotech ETFs
Players In The Future 5G Playground


