

Image Source: Pexels
ETHUSD Longs/Shorts ratio chart is at 3-year low due to massive rise on ETHUSD shorts, because speculators want to short Ethereum, but that usually indicates for the support. Notice that Ethereum is right now testing previous highs that can act as a support, so there could be space for more gains.
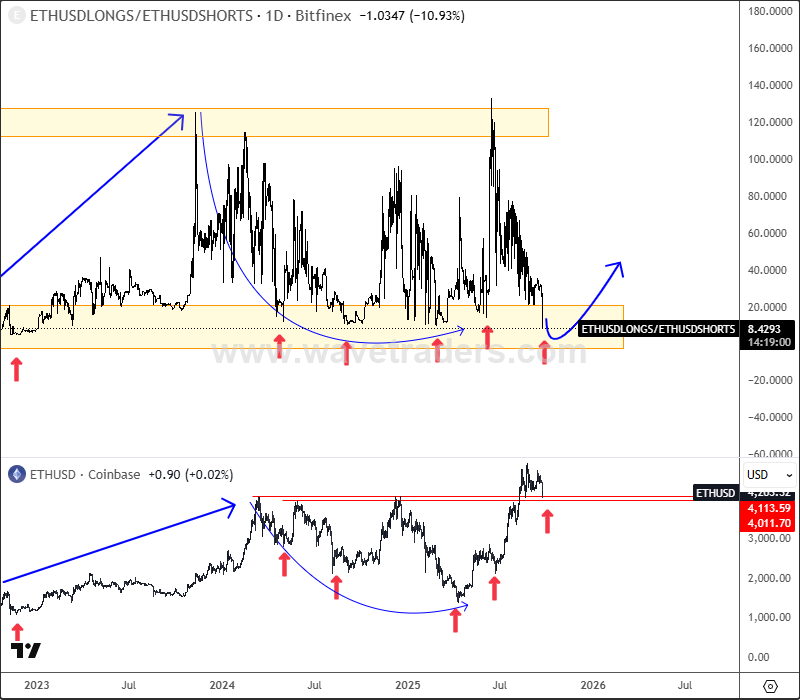
ETHUSD Longs/Shorts Ratio Daily Chart
Ethereum ETFs still look like a higher degree wave 4 correction, which can extend the rally for the 5th wave. Grayscale Ethereum ETF(ETHE) could retest base channel upper line as support before a bullish continuation for wave 5 towards 2021 highs.
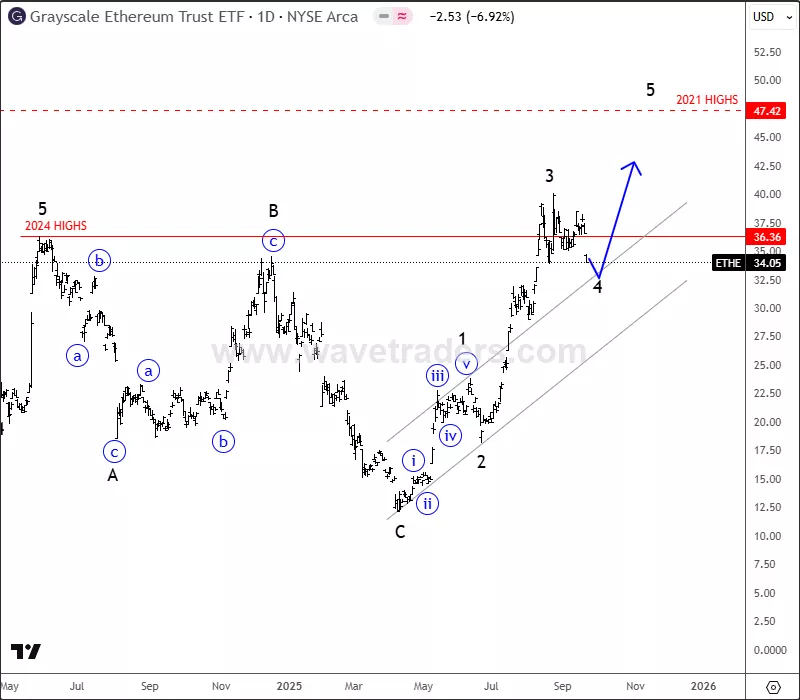
ETHE Daily Chart
BlackRock's Ethereum ETF(ETHA) is now testing previous December 2024 high and former wave 4 swing low, right around base channel upper line, which is an ideal zone for a higher degree wave (4), so still be aware of another push to the upside within wave (5).
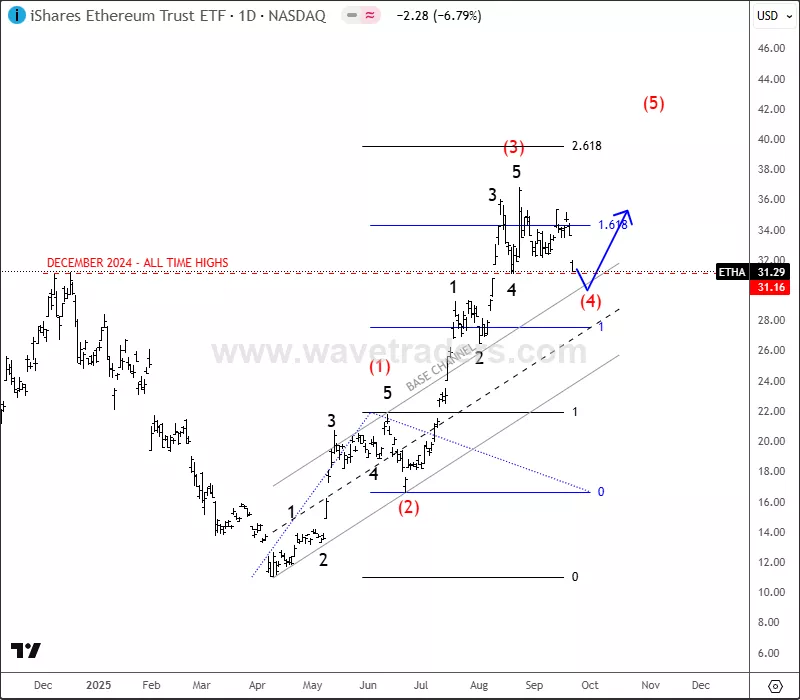
ETHA Daily Chart
For a detailed view and more analysis like this, you can watch our latest recording of a live webinar streamed on September 22: Direct Link HERE
More By This Author:
Alphabet Extends Higher Within A Bullish Impulse
Crypto Market Is Nicely Recovering, But Into Some Key Levels Ahead Of Fed
S&P 500 Keeps Pushing Higher Within An Impulse


Comments
Log in or sign up to join the conversation.