

Image Source: Pixabay
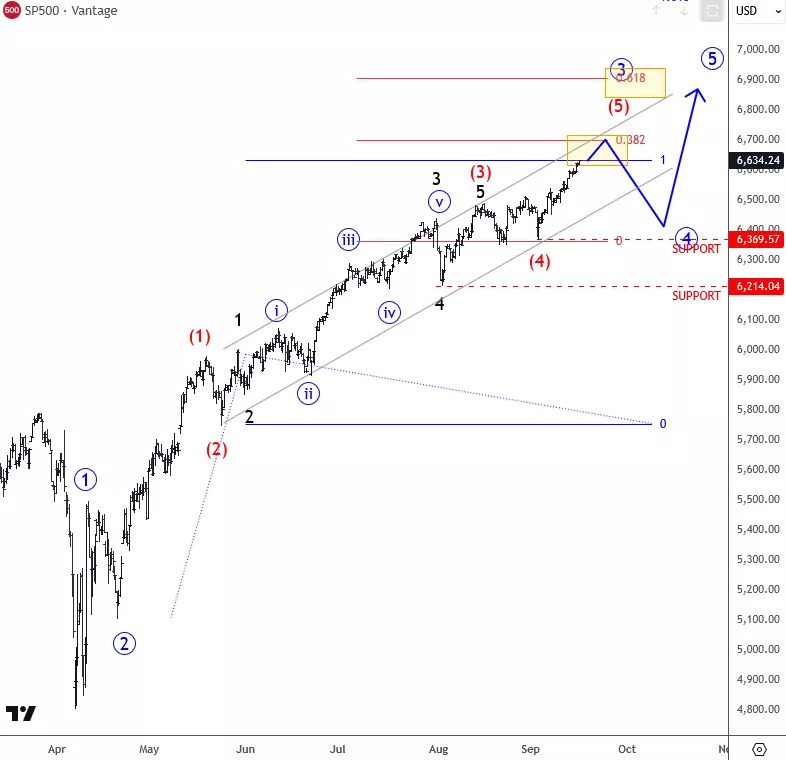
The S&P 500 moved higher in August but found limited upside around 6500, from where we saw some retracement. But a temporary one that stopped at 6351 horizontal support that might have been subwave four; ideally, of an extended blue wave 3 cycle that is now at first Fib. zone here at 6640-6700. Higher resistance is near 6900 if red wave (5) will become more extended. If we see any next retracement, if the Fed won't confirm further cuts, in the months ahead, then the next setback will be just wave four within the uptrend.
SP500 8H Chart
A five-wave bullish impulse in Elliott Wave theory represents a complete trending move: waves 1, 3, and 5 advance with the trend, while waves 2 and 4 are corrective pauses. For a true top to form, this impulse must be fully complete across all relevant degrees (timeframes), meaning that each wave structure is internally satisfied. Only then can a larger corrective phase begin, signaling that the bullish advance has exhausted.
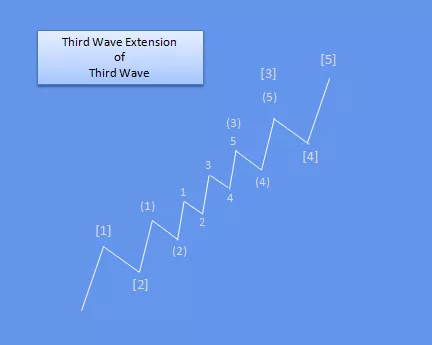
Basic Elliott wave bullish impulse
For a detailed view and more analysis like this, you can watch our latest recording of a live webinar streamed on September 15: DIRECT LINK
More By This Author:
Stellar Shows Clear Impulsive Bullish Structure
Bitcoin Miners Are On Fire
AMD Still Bullish Despite 20% Pullback


Comments
Log in or sign up to join the conversation.