
Elliott Wave Analysis TradingLounge Daily Chart, August 31 2022, Ethereum(ETH-X)

ETHUSD Elliott Wave Technical Analysis
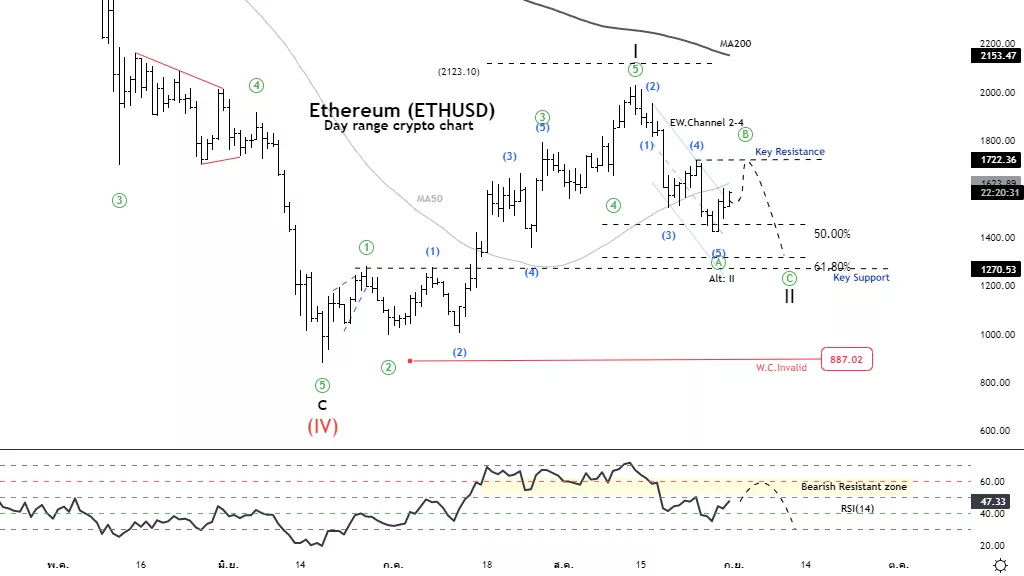
Function: Counter trend
Mode: Corrective
Structure: Zigzag
Position: Wave A
Direction Next higher Degrees: Impulse wave (II) Details: A decrease in wave ((A)) first increases in wave ((B)) and decreases again in wave ((C)).
Wave Cancel invalid Level: 887.02
Ethereum(ETHUSD)Trading Strategy: Wave ((B)) may end at the previous fourth wave. And the price wil fal again in wave ((C)), so it might be a good opportunity to look
for opportunities in short positions. short-term Ethereum(ETHUSD) Technical Indicators: RSI entering bearish resistance zone TradingLounge
Technical Analyst: Kittiampon Somboonsod
Elliott Wave Analysis TradingLounge 4H Chart, August 31, 2022, Ethereum (ETHUSD)
ETHUSD Elliott Wave Technical Analysis
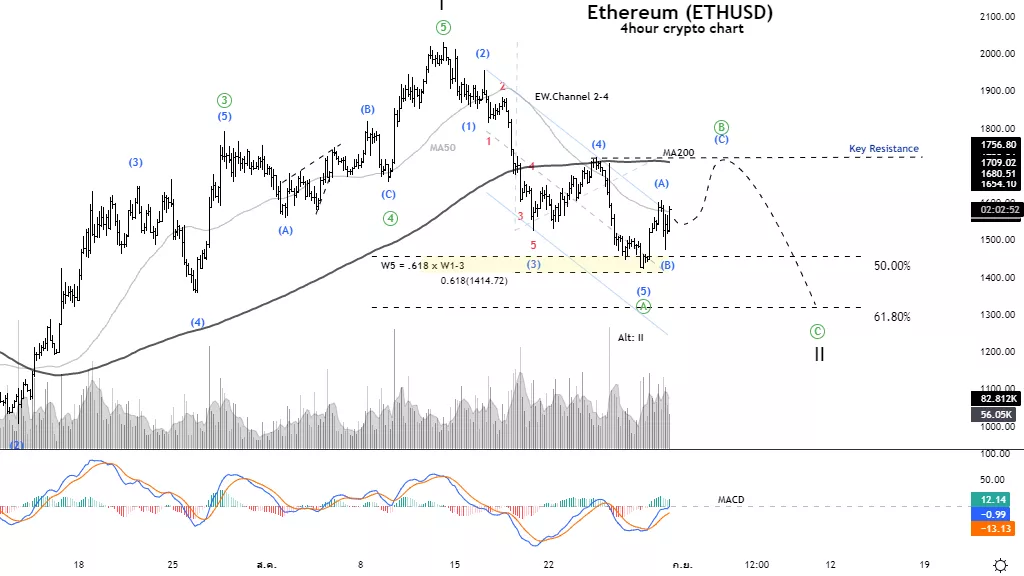
Function: Counter trend
Mode: Corrective
Structure: Flat
Position: Wave (4)
Direction Next higher Degrees: Sub-wave in wave ((A)) of Zigzag Details: A decrease in wave ((A)) first increases in wave ((B)) and decreases again in wave ((C)).
Wave Cancel invalid Level:
Ethereum(ETHUSD)Trading Strategy: Wave ((B)) may end at the previous fourth wave. And the price wil fal again in wave ((C)), so it might be a good opportunity to look
for opportunities in short positions. short-term Ethereum (ETHUSD) Technical Indicators: The MA50 line crosses the MA200 line as a bearish signal. The price may pull
back to test the MA200 resistance.
More By This Author:
Elliott Wave Technical Analysis: Broadcom Inc. (AVGO)
Uniswap Elliott Wave Analysis - Tuesday, Aug. 30
European Indices: DAX 40, FTSE 100, STOXX 50, GBPUSD, EURUSD


Comments
Log in or sign up to join the conversation.