

Image Source: Unsplash
Broadcom Inc., Elliott Wave Technical Analysis
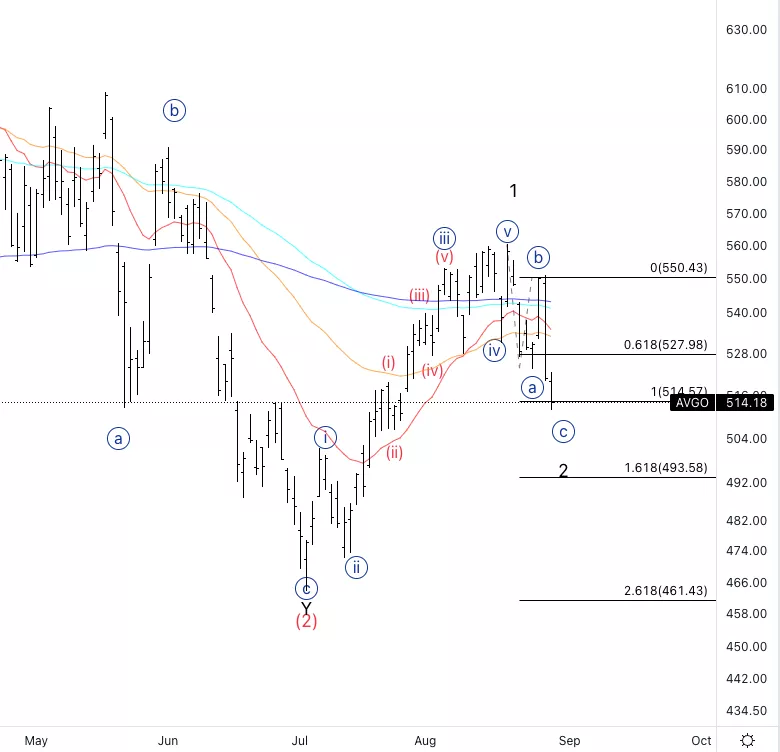
Broadcom Inc., (Nasdaq: AVGO): Daily Chart, August 30, 2022,
AVGO Stock Market Analysis: After moving as expected from the previous forecast, we are looking for a bounce as we have approached the equality of wave {a} and {c}.
AVGO Elliott Wave count: {c} of 2
AVGO Trading Strategy: Looking for a bounce to the upside in wave {i} to potentially break the top of wave {b}.
AVGO Technical Indicators: We moved below the averages however we could easily bounce back.
Analyst: Alessio Barretta
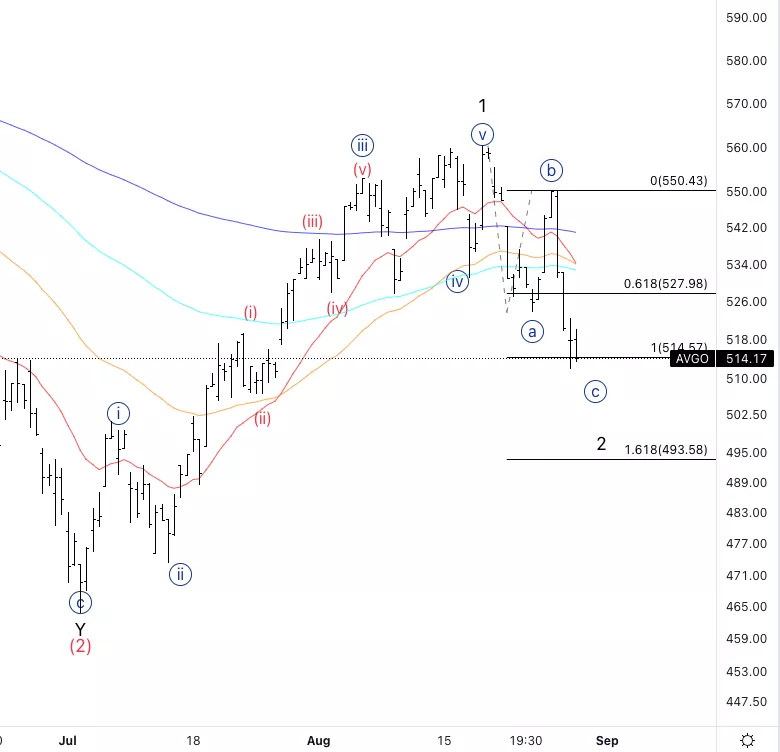
Broadcom Inc., AVGO: 4-hour Chart, August 30, 2022,
Broadcom Inc., Elliott Wave Technical Analysis
AVGO Stock Market Analysis: Looking for wave (iv) of {c} to be on the horizon, looking for one last move down into wave (v).
AVGO Elliott Wave count: Wave (v) of {c}.
AVGO Technical Indicators: Indicators are not yet suggesting a bullish move, which is why we are waiting for confirmation.
AVGO Trading Strategy: Very short term we could look for a small short to move a bit lower. Alternatively, we would wait for upside confirmation.
More By This Author:
Uniswap Elliott Wave Analysis - Tuesday, Aug. 30
European Indices: DAX 40, FTSE 100, STOXX 50, GBPUSD, EURUSD
Elliott Wave Technical Analysis: ASX200, BHP, RIO, FMG, NCM, DXY, AUDUSD


Comments
Log in or sign up to join the conversation.