
Will The Dow Jones Continue Higher? Will The Nasdaq Follow?

It's been a volatile few weeks in the markets, and it can be hard to tell if we're currently in a risk-on or risk-off environment.
Have we seen the market lows for 2022, or will the market reverse lower before the end of the year?
The market indicates that investors favor large-cap defensive sectors. The Dow Jones leads the indices (as represented by DIA above), with utilities, consumer staples, and healthcare sectors ahead of the pack.
Looking at the major indices, DIA is the only major US index above its 200-week moving average and also the only index above its 200-day moving average. DIA needs to hold 329 at the weekly close to remain in an uptrend.
Many pundits are debating whether we will have a Fed-engineered soft landing or a deep recession in 2023.
Will OPEC cut production or raise levels? Will we exhaust the strategic petroleum reserves, or will the move to deplete the SPR combat inflation effectively and keep oil prices down in 2023?
These are fair questions to anticipate clarifying current risk on or risk off sentiment.
So, where does the market go from here?
This market has been anything but stable of late - one minute up, then down within days.
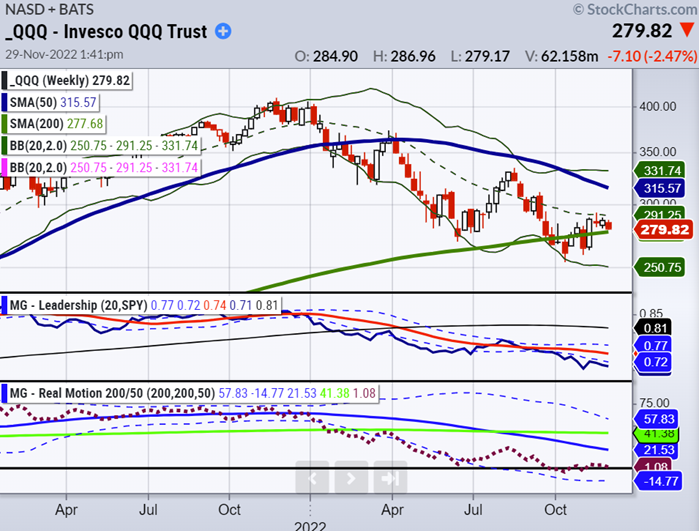
The Nasdaq Composite (represented by QQQ) is in a recovery phase along with the S&P 500 (SPY) and small caps (IWM). The QQQs need to hold their weekly trend and stay above 281 at the weekly close to neutralize further downside.
Other indicators are less reliable than price, momentum, and phase. For example, the yield curve is inverted on the short-term part of the curve yet remains relatively flat on the longer end, providing little clarity into where long-term rates are ultimately headed.
The yield curve also continues to invert on the short end while remaining flat on the longer end, which could be an early indicator of a recession. Yet, third-quarter GDP estimates are looking encouraging.
The risk-on/risk-off phenomenon has existed for as long as financial markets have existed. There are clearly many mixed signals today.
Understanding how the risk-on/risk-off construct works can help you make more informed trading decisions and protect your portfolio against dramatic swings.
ETF Summary
S&P 500 (SPY) The resistance at 400-405 remains persistent with support at 387.
Russell 2000 (IWM) 190 is the ultimate point to clear. Support to hold 180.
Dow (DIA) Inside week which means we want to see this hold 335.50 to stay in the game.
Nasdaq (QQQ) Weakest index. Has to clear 290 or hold 275 or trouble.
KRE (Regional Banks) 65.00 resistance 60 support.
SMH (Semiconductors) 209 is the biggest support level to hold.
IYT (Transportation) 217 support and big resistance at 232.
IBB (Biotechnology) 129 support and 135 resistance
XRT (Retail) Over 67.00 we could see a Santa’s rally. Under 62.00 big failure.
More By This Author:
Is The Market on Better Footing Now?
What To Expect From Granny Retail This Holiday Weekend
This Semiconductor ETF Might Signal A Chip Recovery
Disclaimer: The information provided by us is for educational and informational purposes. This information is based on our trading experience and beliefs. The information on this website is not ...
more

