
Why You Can’t Judge A Fund By Its Cover

This week we’re putting RidgeWorth Mid Cap Value Fund (SAMVX), which has $4.6 billion in assets under management, in the Danger Zone for a number of reasons:
- Poor stock picking
- Very high total annual costs with high front end load and transaction costs
- A misleading “Mid Cap Value” tagline
- A “value” designation despite investing in heavily overvalued companies
As a result of its poor portfolio and high costs, SAMVX earns our Very Dangerous rating. SAMVX is a perfect example of why investors need to do their own diligence on the funds they allocate to. We think that SAMVX wouldn’t be nearly as large if more investors knew what was going on under of the cover of this fund.
Bad Stock Picking No Matter How You Spin It
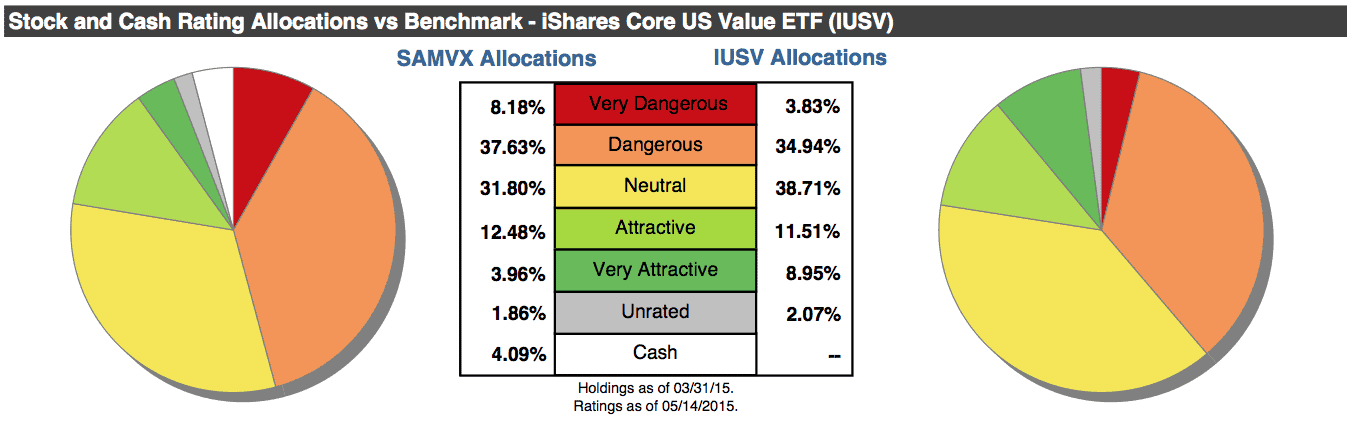
We rate each of the ETFs and mutual funds under our coverage based on the quality of stocks they hold. SAMVX gets our Dangerous Portfolio Management rating primarily because 46% of SAMVX’s holdings earn our Dangerous or Very Dangerous ratings while only 16% of SAMVX’s holdings are allocated to Attractive or Very Attractive stocks.
Compare these holdings to those of SAMVX’s benchmark, the iShares Core U.S. Value ETF (IUSV). We rate only 39% of IUSV’s holdings as Dangerous or Very Dangerous, while almost 20% of its holdings earn Attractive or Very Attractive ratings.
Figure 1: Rising GAAP Net Income Masks Declining Profitability
Sources: New Constructs, LLC and company filings.
Don’t Be Fooled by the Low Expense Ratio
Investors would have a right to expect mediocre stock picking from SAMVX if it were a cheap fund. However, this isn’t the case.
Despite the fund’s stated expense ratio of 1.59%, SAMVX actually has Very Dangerous total annual costs of 4.02%. The reason for these high costs is SAMVX’s high front end load of 5.75% and its high transaction costs of 0.23%. The reason for these transaction costs is the fund’s high turnover rate of 108%.
What do these high costs mean? Consider that IUSV has total annual costs of just 0.10%. To justify the additional costs above its benchmark, SAMVX must outperform IUSV by 3.92% annually over three years. What’s concerning is that this outperformance hasn’t happened. Over the past three years, IUSV has delivered an 18% annualized return while SAMVX has delivered just a 16% annualized return. In addition, any outperformance going forward doesn’t look likely due to SAMVX’s inferior stocks relative to IUSV.
In short, investors are paying higher fees for inferior performance.
What Style Are Investors Getting in SAMVX? (Hint: It’s Not Mid Cap Value)
SAMVX bills itself as a “Mid Cap Value” fund. If you look closer though, SAMVX more closely resembles an All Cap Value fund with a blend of large and small cap stocks mixed in with the mid caps.
For example, SAMVX’s top equity holding is SanDisk (SNDK), a $14 billion company. Its fifth largest holding is NetApp (NTAP), an $11 billion company, and its seventh largest holding is the $17 billion Hartford Financial Services Group (HIG). You know how the saying goes: never judge a book by its cover.
A look at SAMVX’s Morningstar page would not help either, as Morningstar does not actually include the “All Cap” designation. Rather, the firm averages SAMVX’s holdings’ market caps, which yields a “Mid Cap Blend” classification — which is clearly inaccurate based on the market cap of some of SAMVX’s top holdings above.
No matter SAMVX’s actual style, both the Mid Cap Value and All Cap Value styles earn a Neutral rating in our 2Q15 Style Ratings report. It’s disappointing that SAMVX cannot earn at least a Neutral portfolio management rating despite selecting from so many large cap stocks outside of its supposed “Mid Cap Value” constraints.
About That “Value” Focus…
Last on our list of concerns with SAMVX is the fund’s misleading “value” investing style. For more on SAMVX’s selection methodology, we’ll turn to the fund’s prospectus, which states that the fund intends to “key in on those companies that are in the lower third of their own historical valuations.
We think that this valuation methodology is weak and subjective. It is certainly not comparable across companies and gives little weight to the underlying health of the businesses it invests in. Let’s use an example from SAMVX’s own portfolio: its second largest holding Omnicare (OCR). This aforementioned methodology wouldn’t take into account the $877 million in deferred taxes that Omnicare (OCR) owes (10% of market cap).
As a result of senior claims on cash flows like these, OCR has a price to economic book value ratio (PEBV) of 3.6. In fact, SAMVX’s holdings have a weighted average PEBV of 3.7. This number implies that the market’s average expectation for the profits of this portfolio’s companies is for profits to increase by 370%. Does this sound like value investing to you?
So in Summary:
SAMVX has poor portfolio management relative to its benchmark and style and high total annual costs despite underperforming its benchmark. Its self-classified style is also misleading based on a brief look at its top 10 holdings and its “value” focus is simplistic and flawed. These conclusions are perfect examples of what just a little diligence can tell you about whether or not a fund’s name is backed up by its substance.
Disclosure: New Constructs staff receive no compensation to write about any specific stock, sector, or theme.


Excellent post.