
What Does November Hold For The Miners?
As a new month begins, the downtrend in the GDX and GDXJ should resume. When will a new buying opportunity finally present itself?
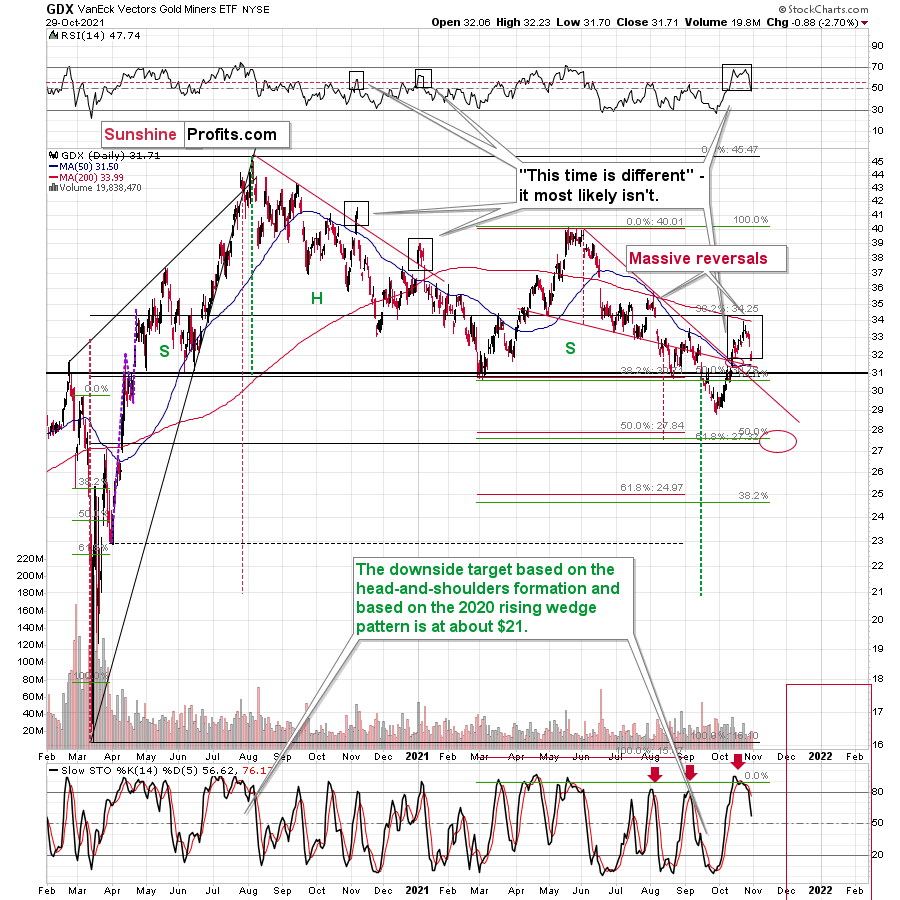
Let’s compare the behavior of the GDX ETF and the GDXJ ETF. Regarding the former, the GDX ETF reversed sharply after reaching its 200-day moving average and a confluence of bearish indicators signaled a similar outcome. For context, I wrote on Oct. 25:
Small breakout mirrors what we witnessed during the senior miners’ downtrend in late 2020/early 2021. Moreover, when the GDX ETF’s RSI (Relative Strength Index) approached 70 (overbought conditions) back then, the highs were in (or near) and sharp reversals followed.
Furthermore, after a sharp intraday reversal materialized on Oct. 22, the about-face is similar to the major reversal that we witnessed in early August. On top of that, with the GDX ETF’s stochastic indicator also screaming overbought conditions, the senior miners are likely to move lower sooner rather than later.
Also, please note that the GDX ETF reversed right after moving close to its 200-day moving average, which is exactly what stopped it in early August. Yes – that’s another link between now and early August.
And after declining sharply on Oct. 28 and Oct. 29, the senior miners further cemented their underperformance of gold. Moreover, with relative underperformance often a precursor to much larger declines, the outlook for the GDX ETF remains quite bearish.
Please see below:
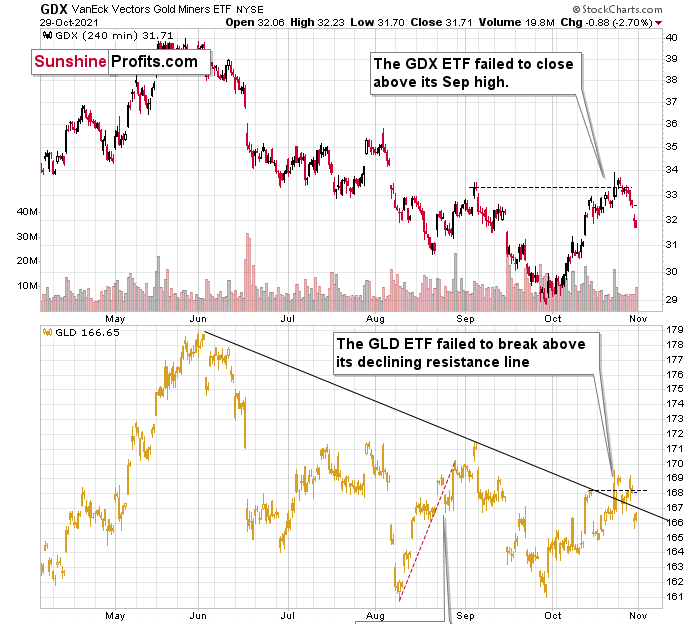
As further evidence, the GDX ETF’s four-hour chart offers some important insights. To explain, the senior miners failed to hold their early September highs and last week’s plunge removed any and all doubt. Likewise, the GLD ETF suffered a sharp drawdown and its recent breakout was also invalidated.
Furthermore, my three-day rule for confirming breakouts/breakdowns proved prescient once again. Conversely, investors that piled into mining stocks are likely regretting their decision to act on unconfirmed signals. And as we look ahead, the technicals imply that caution is warranted and more downside is likely for the GDX ETF.
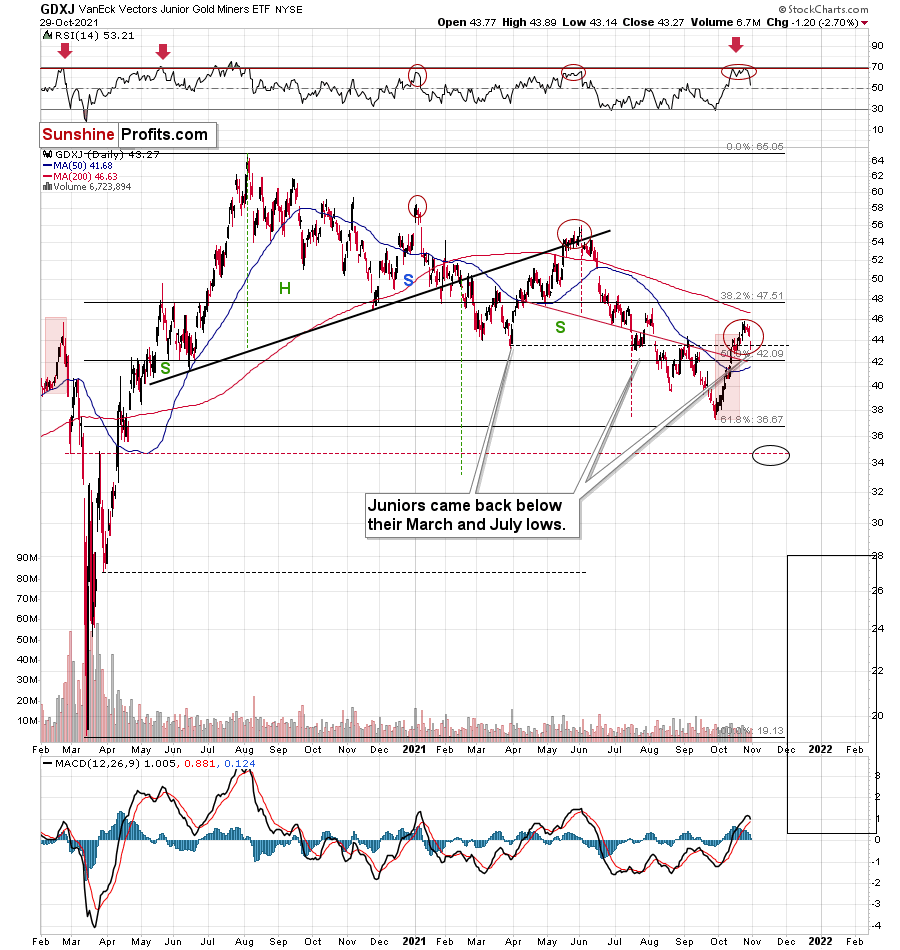
As for the GDXJ ETF, the gold junior miners suffered a similar swoon last week. For context, I warned of the prospective reversal on Oct. 25. I wrote:
The junior miners’ RSI also signals overbought conditions and history has been unkind when similar developments have occurred. Moreover, the GDXJ ETF’s recent rally follows the bearish patterns that we witnessed in late May and in early 2021. Likewise, the intraday reversal on Oct. 22 mirrors the bearish reversal from early August and a confluence of indicators support a continuation of the downtrend over the coming weeks.
And as we begin a new month, the GDXJ ETF’s downtrend should resume and a retracement to the ~35 level will likely materialize in the coming months.
Please see below:
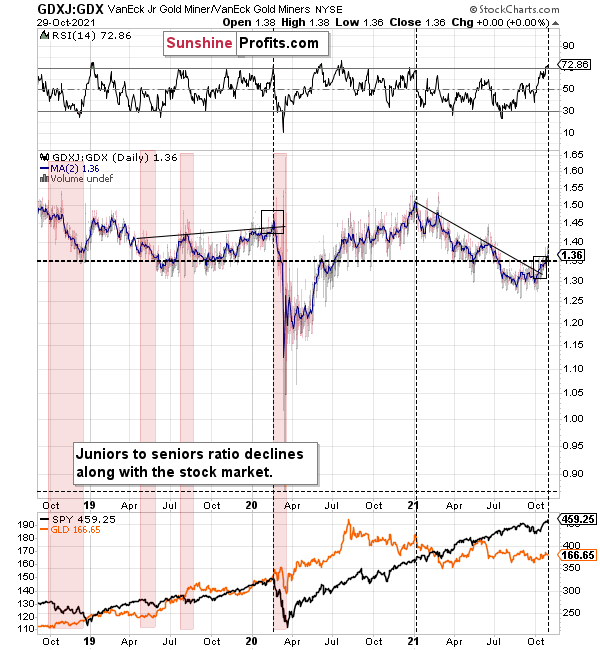
Finally, while I’ve been warning for months that the GDXJ/GDX ratio was destined for devaluation, the ratio has fallen precipitously in 2021. And after the recent short-term rally, the ratio’s RSI has reached extremely elevated levels (nearly 73) and similar periods of euphoria have preceded major drawdowns (marked with the black vertical dashed lines below).
To that point, the ratio showcased a similar overbought reading in early 2020 – right before the S&P 500 plunged. On top of that, the ratio is still below its mid-to-late 2020 lows and its mid-2021 lows. As a result, the GDXJ ETF will likely underperform the GDX ETF over the next few months. It’s likely to underperform silver in the near term as well.
The bottom line?
If the ratio is likely to continue its decline, then on a short-term basis we can expect it to trade at 1.27 or so. If the general stock market plunges, the ratio could move much lower, but let’s assume that stocks decline moderately or that they do nothing or rally slightly. They’ve done all the above recently, so it’s natural to expect that this will be the case. Consequently, the trend in the GDXJ to GDX ratio would also be likely to continue, and thus expecting a move to about 1.26 - 1.27 seems rational.
If the GDX is about to decline to approximately $28 before correcting, then we might expect the GDXJ to decline to about $28 x 1.27 = $35.56 or $28 x 1.26 = $35.28. In other words, ~$28 in the GDX is likely to correspond to about $35 in the GDXJ.
Is there any technical support around $35 that would be likely to stop the decline? Yes. It’s provided by the late-Feb. 2020 low ($34.70) and the late-March high ($34.84). There’s also the late-April low at $35.63.
Consequently, it seems that expecting the GDXJ to decline to about $35 is justified from the technical point of view as well.
In conclusion, mining stocks reprised their role as ‘The Boy Who Cried Wolf.’ And after overzealous investors rushed to their defense last week, another false alarm led to another bout of disappointment. Moreover, with the technical and fundamental backdrops for gold, silver and mining stocks continuing to deteriorate, lower lows should materialize over the medium term. As a result, we may have to wait until 2022 before reliable buying opportunities emerge once again.
Disclaimer: All essays, research and information found on the Website represent the analyses and opinions of Mr. Radomski and Sunshine Profits' associates only. As such, it may prove wrong ...
more


This week, unless you know what you're doing, both longs and shorts will lose.