

Image Source: Pixabay
Following through on the previous week's bearish reversal and spooked by the implications of a three-quarter point rate hike, traders bailed out in a big way last week. The S&P 500 lost 4.6% of its value over the course of the five-day stretch, and while that wasn't quite the lowest close the index has logged this year, the Dow Jones Industrial Average did log its lowest close.
Both indexes now sit more than 20% below their peaks reached right at the beginning of the year, into bear market territory.
It's tempting to entertain the possibility that the two-week selloff has set the stage for a big rebound. And, perhaps that's what's in the cards; we're certainly at a time of year when things tend to start taking a turn for the better. Realistically speaking though, most signs suggest we're in for a little more downside.
We'll dissect the action and likely future in a moment. First, let's recap last week's key economic announcements and preview what's coming this week.
Economic Data Analysis
It was a fairly quiet week in terms of economic news, with the exception of Wednesday's interest rate decision; if you're reading this, then you already likely know the Federal Reserve raised the fed funds rate by the expected three-quarters of a point. That accounts for the bulk of last week's market pullback.
Still, we have a couple of other items worth noting - both of them from the real estate arena. On Tuesday, we heard about last month's housing starts and building permits. Starts jumped - surprisingly - from 1.4 million to 1.57 million. Conversely, permits suffered a surprisingly significant setback.
Housing Starts and Building Permits Charts
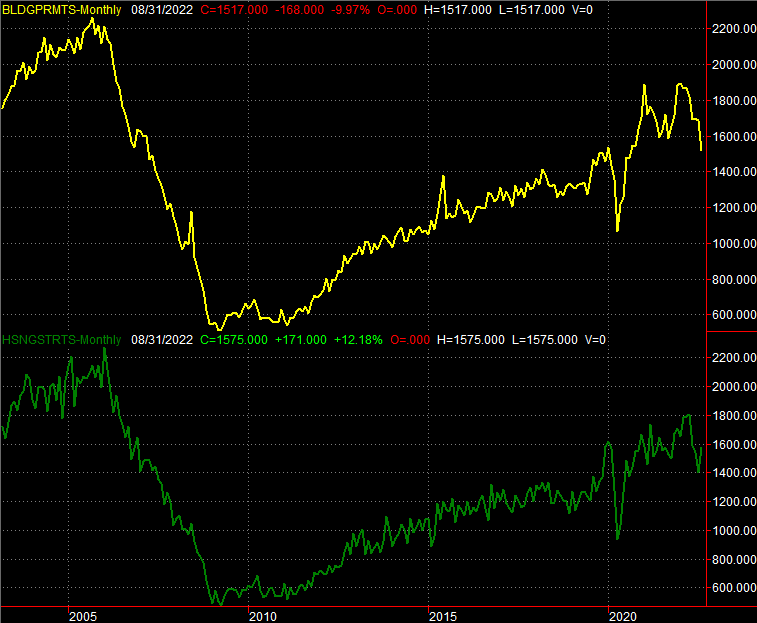
Source: Census Bureau, TradeStation
It's possible this is all the result from last-minute loans put into place before interest rates went up. Regardless, both measures point to a serious slowdown for the housing market, as does last week's report of August's existing home sales. The pace of 4.8 million is only a modest slowdown from July's 4.82 million unit clip, but July's pace was disastrously weak. It's getting difficult to say the housing market is even anything sort-of close to healthy.
New, Existing Home Sales Charts
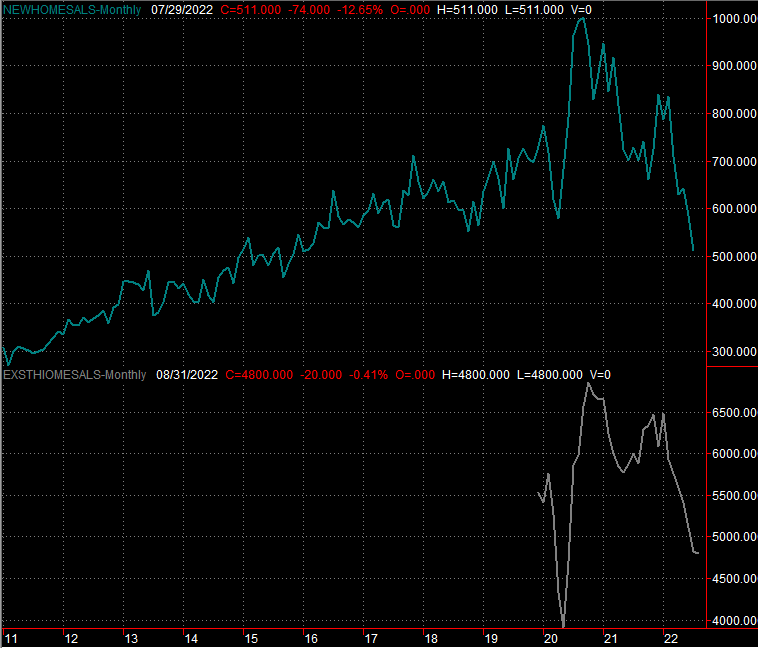
Source: Census Bureau, National Assoc. of Realtors, TradeStation
Last month's new home sales will be posted on Tuesday, with calls for a comparable slowdown. Everything else is on the grid.
Economic Calendar
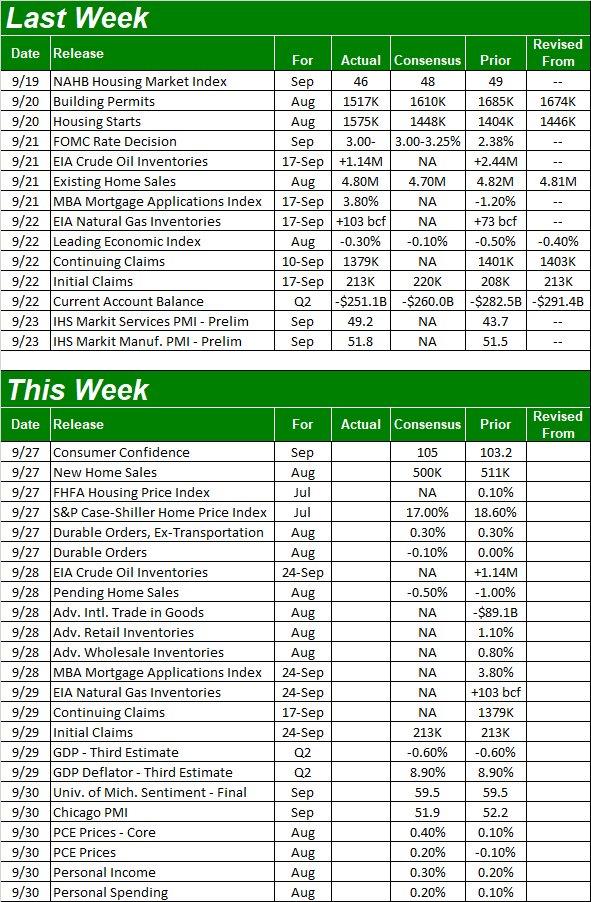
Source: Briefing.com
This week is packed. The party starts on Tuesday with the Conference Board's report on this month's consumer confidence, which will be followed on Thursday by the third and final look at the University of Michigan's sentiment index.
Economists are looking for slight improvements of both measures. Those improvements, however, are of August's relatively weak figures. Overall sentiment remains a liability.
Consumer Sentiment Charts
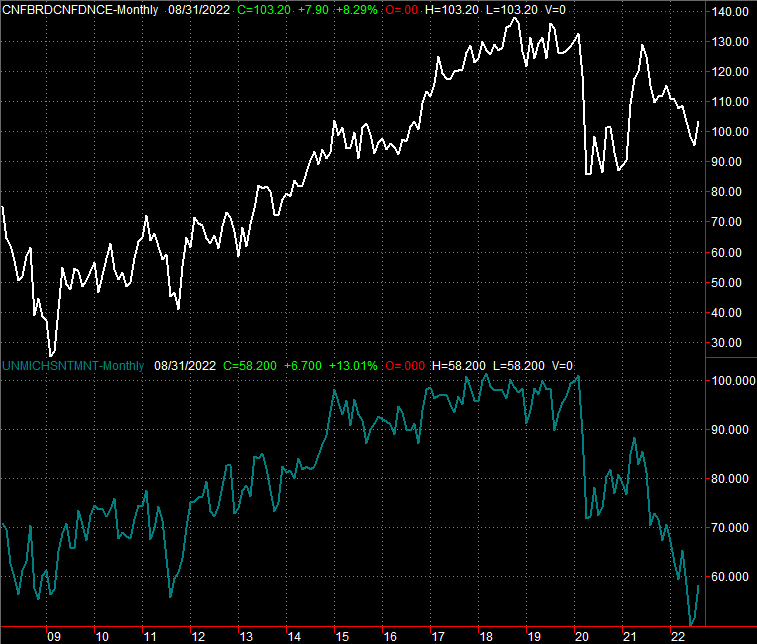
Source: Conference Board, University of Michigan, TradeStation
We'll also round out the real estate picture this week. On Tuesday, look for the FHFA Housing Price Index as well as the S&P Case-Shiller Home Price Index. Home prices are still on the rise, but the pace is expected to continue slowing. And, bear in mind these measures only consider the sales price of a home that's sold. It doesn't consider the actual number of houses sold (or not sold).
Home Price Charts
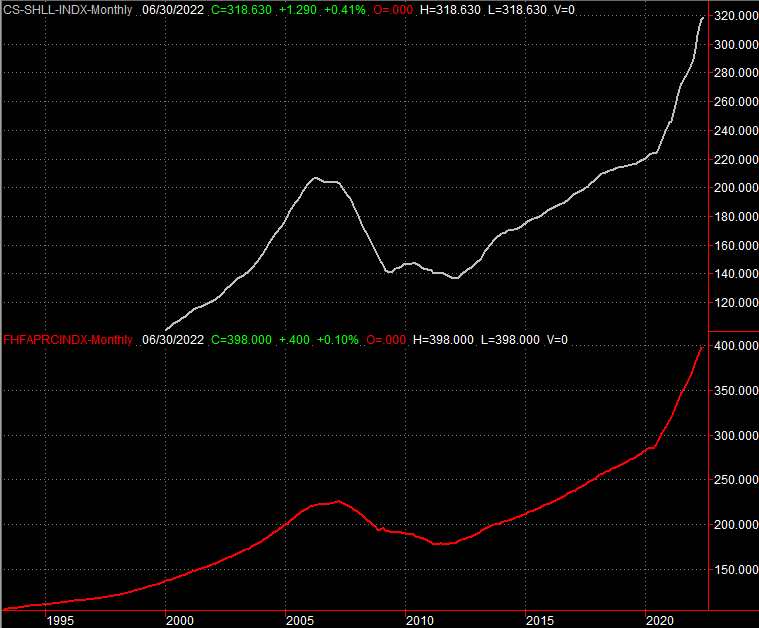
Source: FHFA, Standard & Poor's, TradeStation
There's no chart of it here to view, but finally, know that the third and final estimate of Q2's GDP growth rate is due on Thursday. It should confirm Q2's slowdown, as evidenced by a 0.6% contraction in the nation's gross domestic product.
Stock Market Index Analysis
This week's analysis kicks off with a look at the weekly chart of the S&P 500, as the bigger-picture perspective needs to be understood first. The points of interest aren't just what the market did, but what it didn't do.
What the S&P 500 did do is break all the way under the rising technical floor (green, dashed) that first broke down a couple of weeks ago. After last week's steep selloff though, there's no easy means of getting back above that floor. Doing so will take time and effort.
S&P 500 Weekly Chart, with VIX and Volume
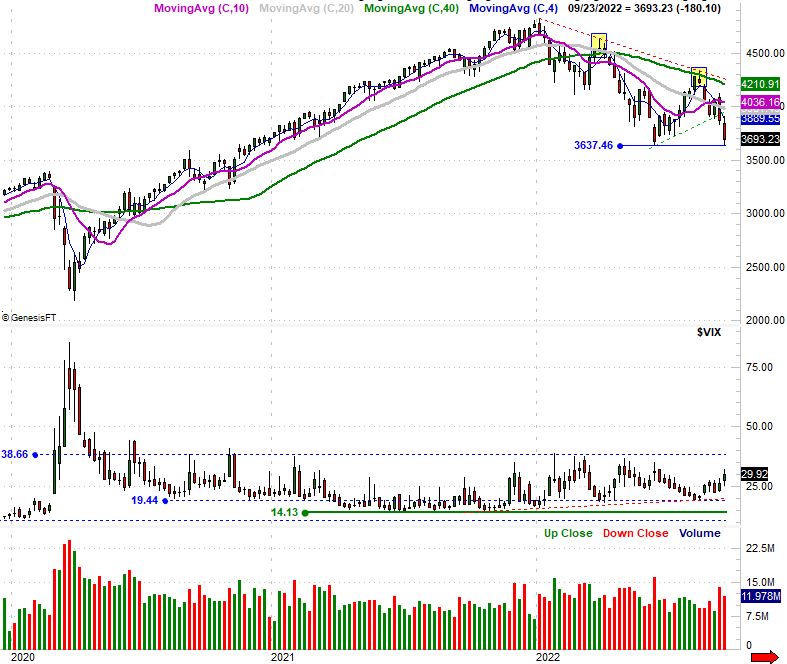
Source: TradeNavigator
There are a couple of things the index didn't do last week, however. One of these is move under June's low around 3637. In fact, last week's low was suspiciously close to that level, suggesting traders may be mentally (even if subconsciously) drawing a line in the sand there.
Something else that didn't happen, however, is that the S&P 500's Volatility Index (VIX) didn't push though a key technical ceiling at 39. In fact, it didn't even hint at testing this ceiling. Historically, the market hasn't made a major bottom in a long, long while without touching this level, which suggests investors have capitulated.
Here's the daily chart of the S&P 500, for a little more detailed perspective. Notice that the S&P 500 was rallying back from its intraday low on Friday as the closing bell approached, while the VIX was peeling back from its intraday high. This (loosely) implies things were turning around for the better as the week came to a close, and it means this week may get things started on a bullish foot.
S&P 500 Daily Chart, with VIX and Volume
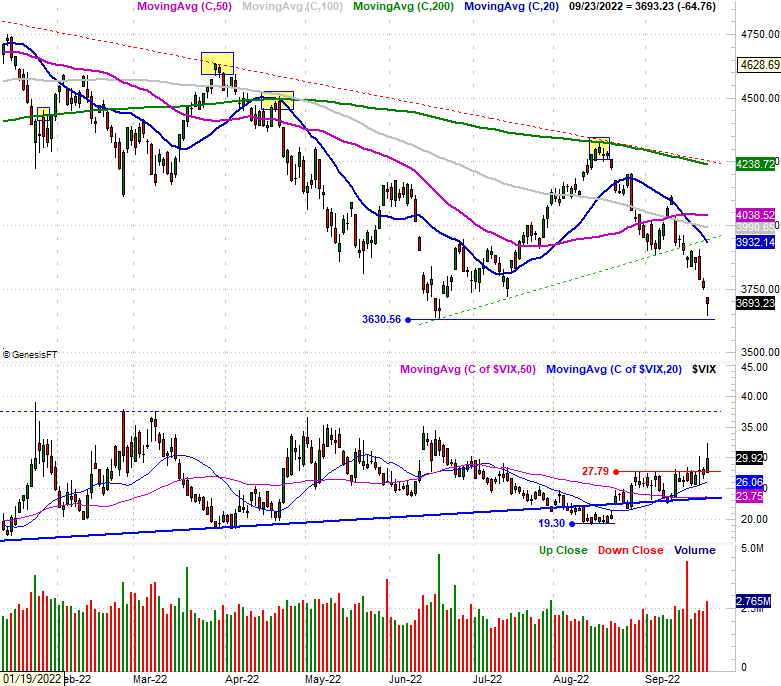
Source: TradeNavigator
Then again, maybe that was just a brief reprieve from three brutally bearish days. We may well kick this week off in the same bearish mood stocks were in for the better part of last week. In this vein, the NYSE's breadth and depth are leaning in a bearish direction as well.
S&P 500 Daily Chart, with NYSE Advancers and Decliners, Up and Down Volume
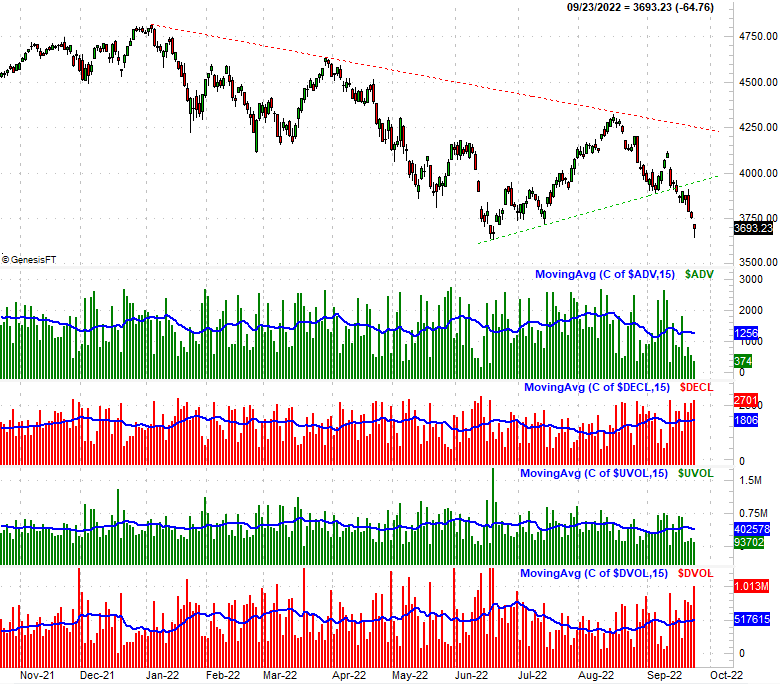
Source: TradeNavigator
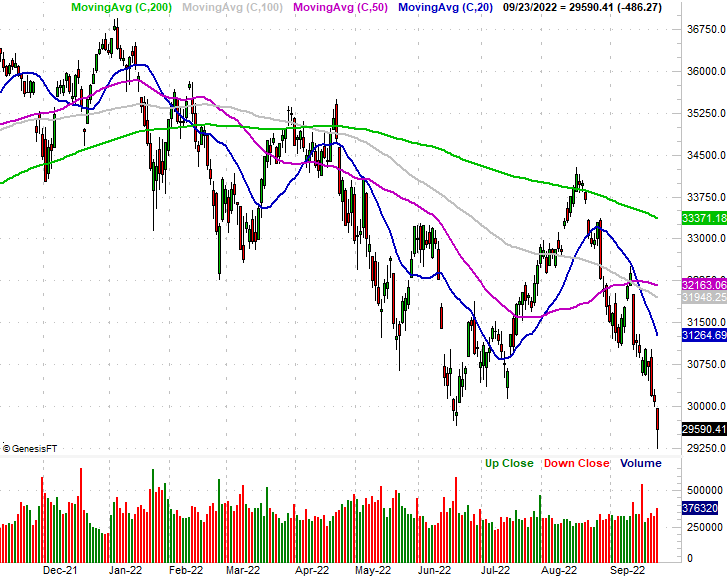
And for the record, the Dow Jones Industrial Average did manage to make a new low for the year on Friday, and it also logged its lowest close of the year that same day. Like the S&P 500, the Dow was pushing up and off of that intraday low as Friday's trading session wound down.
As was also the case with the S&P 500, however, that may merely be the result of some very, very strong selling for a nearly two-week stretch. That doesn't necessarily mean stocks are ready to recover, though. You only have to look back earlier in this year to see that both indexes are more than capable of dishing out bigger, uninterrupted selloffs.
Dow Jones Industrial Average Daily Chart, with Volume
Source: TradeNavigator
Don't be surprised to see stocks creep higher to start this week. Don't read too much into it either, however. That's most likely a dead-cat bounce that doesn't necessarily have much staying power. There's a good amount of room for all of the indices to rally too, before any meaningful resistance can be tested.
Assuming any bullishness doesn't do much long-lived good, what we're really waiting to see is if the S&P 500 can/will break under the 3630 level. If that happens, we'll expect one more round of steep selling, which should serve as a capitulation into the usual fourth quarter bullishness.
More By This Author:
Midweek Update: Wednesday's Gain Is Impressive, But Not Game-Changing... At Least Not YetWeekly Market Outlook - Stocks Go 0 For 3 (And That's Not Even The Worst Of It)
Tuesday's Tumble Puts The Whole Market On The Defensive

Comments
Log in or sign up to join the conversation.