

Image Source: Pexels
If you needed any evidence that stocks are frenzied here, Thursday's and Friday's action supplies it. Down as much as 2.4% early Thursday, the S&P 500 ended that day's trading up 2.6%, with investors changing their minds about how to view inflation.
The bulls followed through briefly on Friday. Before the closing bell rang though, the S&P 500 was down 2.4% to leave the index in the red for the week. It was the lowest close for the index all year, in fact, with more potential downside in store.
The crazy part? Traders didn't actually seem all the surprised or unprepared for the volatile (and mostly bearish) swing. We'll discuss why that's the case in a moment. First, let's run through last week's economic news and preview what's coming this week. It's a pretty big one for real estate data, and things aren't looking especially healthy on this front.
Economic Data Analysis
Inflation was the big news from last week, and broadly speaking, it's bad -- in the sense that there's still plenty of it. The overall annualized consumer inflation rate now stands at 8.2%, and rose to 6.6% on a core basis. Producer inflation rates are peeling back from sky-high levels hit early this year, but they still stand at 8.5% overall and a still-brisk 5.6% when not factoring in the cost of fuel and food.
Consumer and Producer Inflation Charts
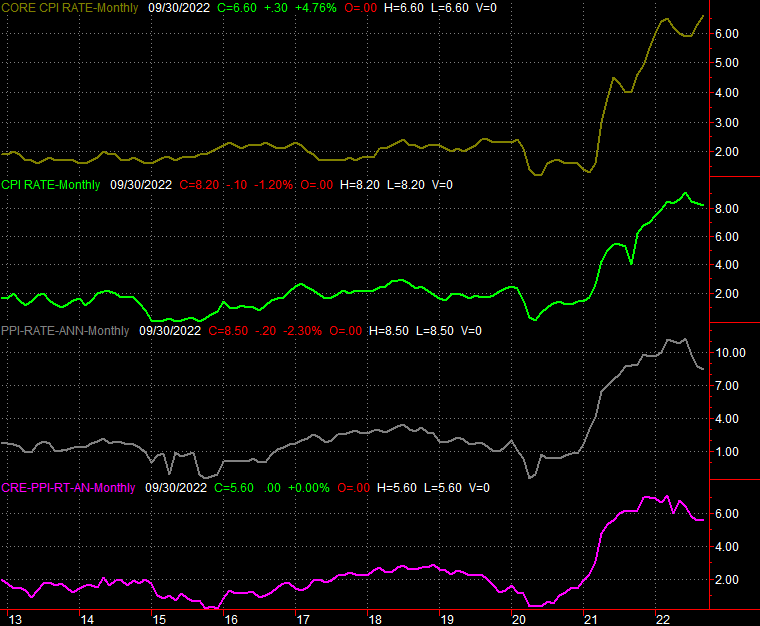
Source: Bureau of Labor Statistics, TradeStation
The lingering high inflation keeps the door wide open for the Federal Reserve to continue raising interest rates as planned; some investors were hoping and even expecting the Fed to cool its plans to do so. The market's volatility late last week indicates that investors aren't quite sure what to make of it, or what it may ultimately mean for stocks.
And Friday's retail sales report didn't help much in that regard. Economists were looking for a bit of increased consumer spending when including automobiles, and flat progress without the car-sales data. Overall spending was basically flat, and well short of expectations when including auto sales.
More than that though, retail spending has essentially been flat for three months now. This is a slowdown, and it could be a warning of an impending contraction in consumer spending.
Retail Sales Charts
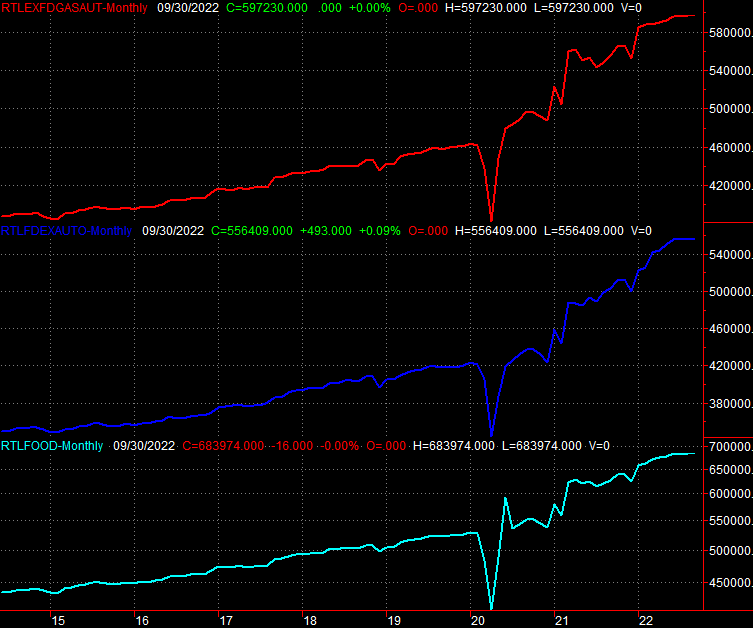
Source: Census Bureau, TradeStation
Everything else is on the grid.
Economic Calendar
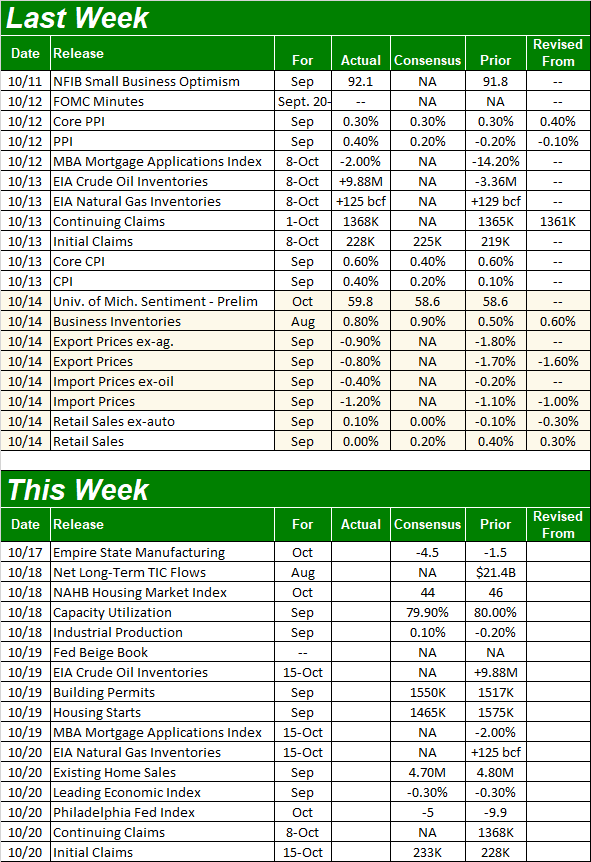
Source: Briefing.com
This week's party starts in earnest on Tuesday, with a look at last month's capacity utilization and industrial production. The country's utilization rate is projected to cool slightly, extending a leveling-off since (no surprise here) the second quarter of this year. The industrial productivity index is leveling off as well, and it shouldn't make any meaningful forward progress this time around.
Capacity Utilization and Industrial Production Charts
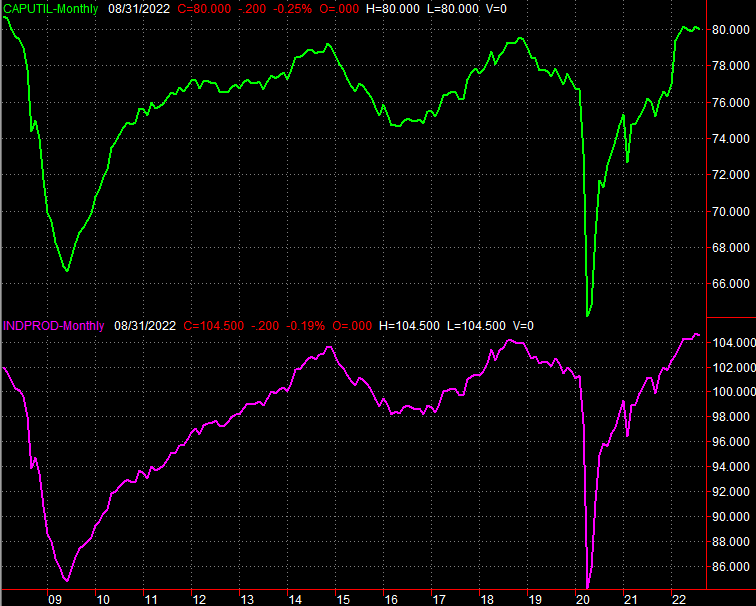
Source: Federal Reserve, TradeStation
This data isn't particularly well-covered by the financial media, though it should be. It strongly correlates with U.S. corporate earnings, and ultimately, the long-term market trend. If it comes up short of already-tepid expectations, it may be a red flag of problems most investors aren't paying attention to.
Look for last month's housing starts and building permits (annualized) data for September on Wednesday. Economists are calling for a slight improvement for permits and a sizable pullback for starts. Just bear in mind that August's permits were disastrously low, and August's starts were up just a bit from a disastrously low figure in July. In other words, there's not likely to be anything particularly bullish on this front this time around.
Housing Starts and Building Permits Charts
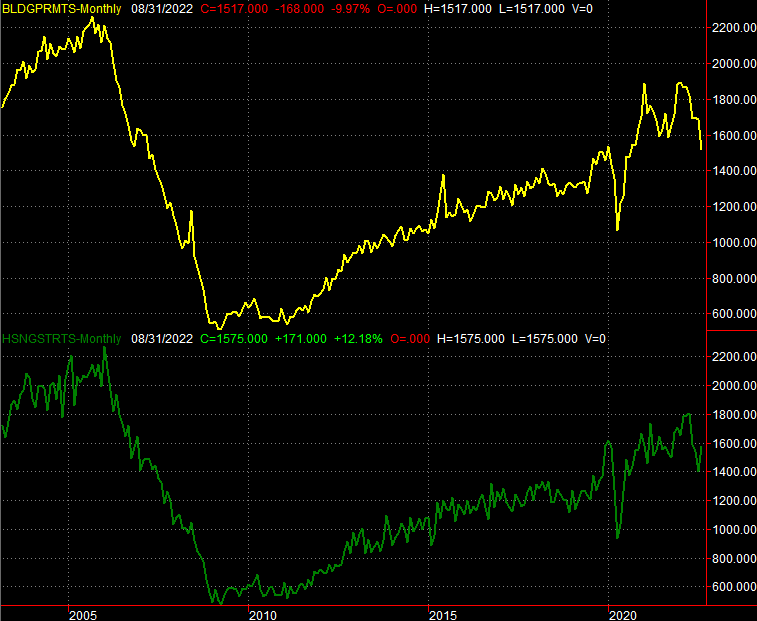
Source: Census Bureau, TradeStation
On Thursday, we'll hear last month's existing home sales figures from the National Association of Realtors. They're expected to have cooled slightly, from 4.8 million to 4.7 million. As was the case with starts and permits though, that's still not an especially bullish figure.
New and Existing Home Sales Charts
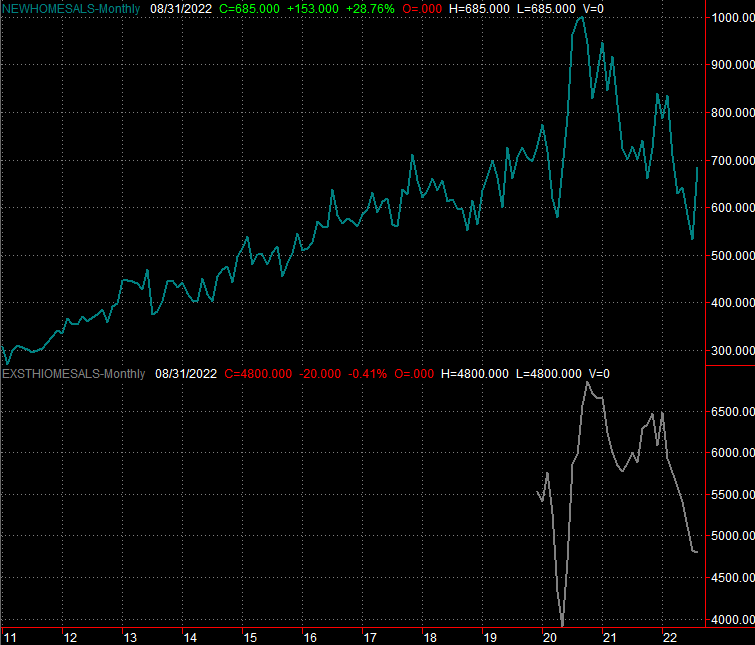
Source: Census Bureau, TradeStation
The new home sales data won't be dropped until next week, but don't look for its downtrend -- or the bigger one for real estate in general -- to be reversed either.
Stock Market Index Analysis
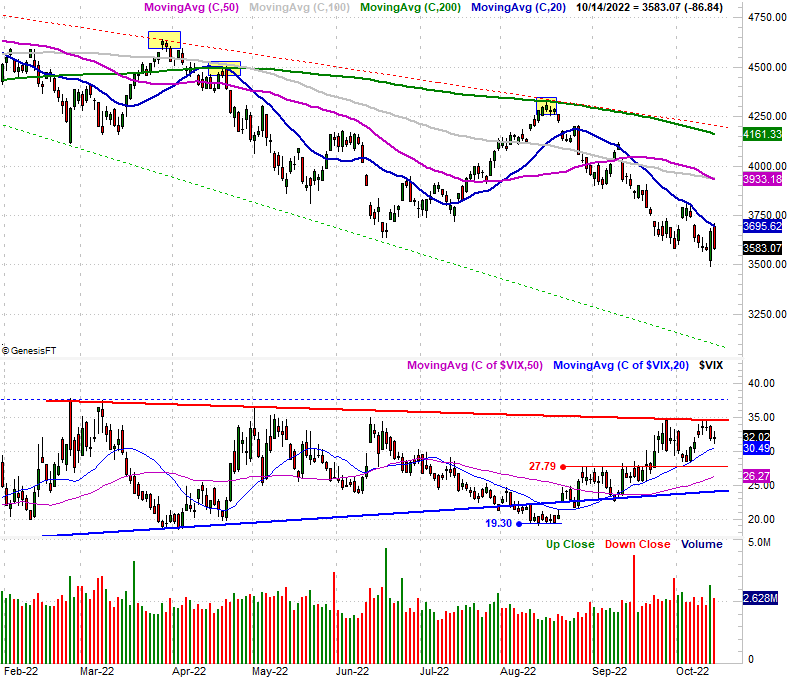
We kick things off this week with a look at the weekly chart of the S&P 500, as it's most important to get some perspective on last week's move first.
The low-to-high bar is relatively tall, but the open to close range is rather narrow and in the middle of the high/low range. It was a lot of volatility, but very little net movement. The net movement we did get, though, extends a downtrend that took shape all the way back in August when the index bumped into the upper edge of a diverging wedge pattern (framed with dashed lines).
If the trading pattern holds up, we're now en route back to the lower edge of that wedge shape. It's currently at 3106, but dropping fast -- meaning it would be much lower before the S&P 500 could feasibly test and touch it.
S&P 500 Weekly Chart, with VIX and Volume
Source: TradeNavigator
This isn't the market's typical action at this time of year. Normally October is a "bear killer," and even if not to end a bear market, fourth-quarter bullishness typically ends weakness in August and September. And, going way back in history, most bear markets last for less than a year -- closer to nine months. That's about how old this one is.
Given that the bear market is still underway at this point, however, it raises the possibility that we may be nowhere near the end of this one.
There's an argument to be made for that possibility, too. While this pullback has shaved off 25% of the S&P 500's value (from January's peak), the average bear market cuts the S&P 500 by one-third. The two most recent bear markets that started in 2000 and 2007 cut the S&P 500 in half. If that sort of move is in the cards this time around, it would ultimately put the S&P 500 somewhere around 3000 before the big bottom is made.
That's where the lower edge of the diverging wedge shape more or less is.
There's something else too; not something that's happened, but something that's not happened. The S&P 500's Volatility Index (VIX) still hasn't given us a sharp surge that typically indicates a capitulation. Go back to March of 2020 to see what you'd expect such a bottom to look like. Indeed, it looks as if the VIX is trapped under a rather strong technical ceiling.
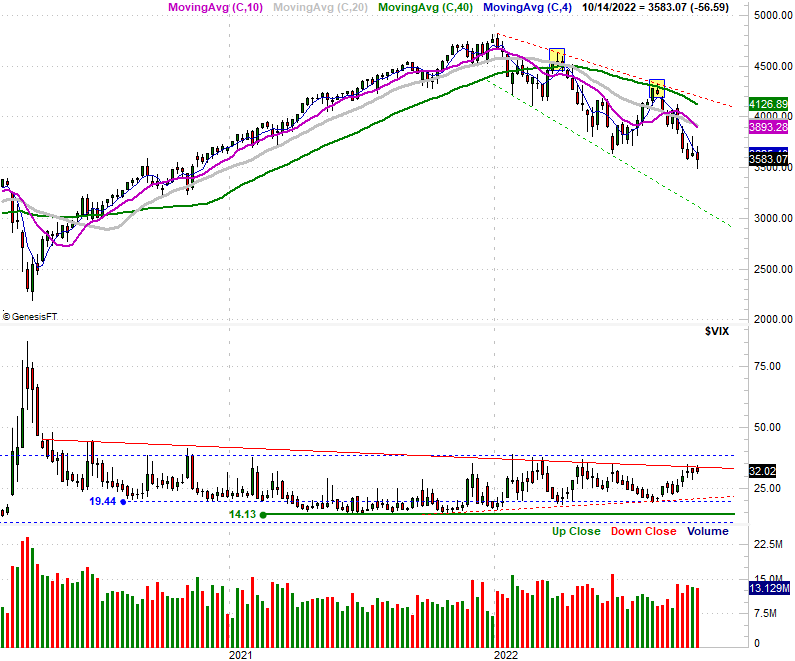
In any case, here's the daily chart of the S&P 500 for a little added detail. From this vantage point you can not only see the index once again only had to kiss the 20-day moving average line (blue) before rekindling the bigger downtrend.
S&P 500 Daily Chart, with VIX and Volume
Source: TradeNavigator
In some ways the Nasdaq Composite's charts tell an even more alarming story. Take a look. The weekly chart of the composite looked like it was going to make a double bottom at 10,570 for a couple of weeks. It pulled under that level last week, though. Now that it has, the selling floodgates are opened.
Nasdaq Composite Weekly Chart, with VXN
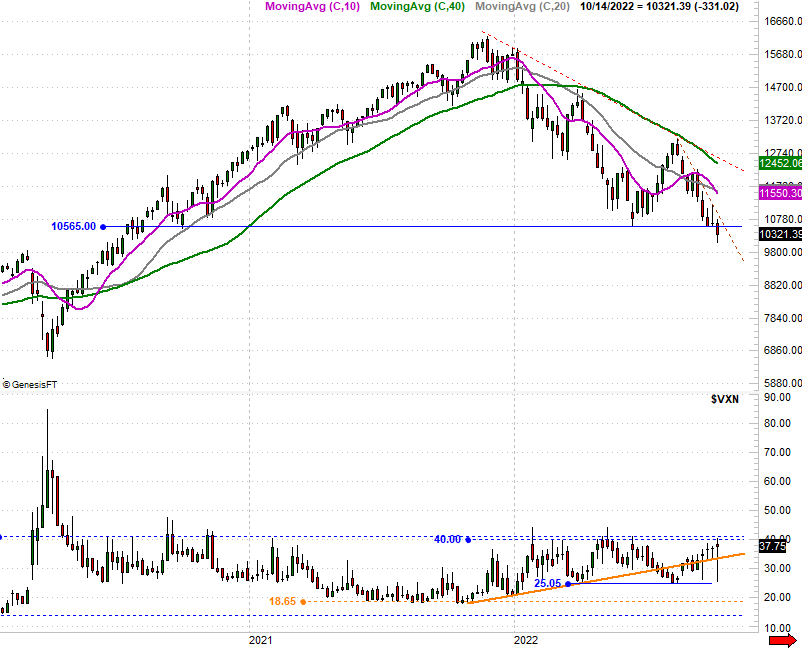
Source: TradeNavigator
The question remains though, will the sellers actually go through them and drive the composite to its ultimate bear market low? That's a definite maybe. The market's been remarkably unpredictable of late, with traders seemingly intent -- even if haphazardly -- on forcing a recovery. The lack of a real blowout capitulation so far, however, is making it tough to keep such an effort in motion.
For the time being, the first big bullish hump to watch is the 20-day moving average lines for both indices.
More By This Author:
Meta Might Be Close to a Bottom. Or Not. The Chart Hints.Weekly Market Outlook - As Rough As Friday Was, The Bulls Still Have A Fighting Chance
Weekly Market Outlook – The Fed Shocked The Market By Doing Exactly What Was Expected

Comments
Log in or sign up to join the conversation.